Recent Reports
Aithisgean ùra
Committee Reports
Aithisgean Chomataidh
Research Briefings
Brathan-ullachaidh Rannsachadh
Feedback
Ais-eòlas
Recent Reports
Aithisgean ùra
Committee Reports
Aithisgean Chomataidh
Research Briefings
Brathan-ullachaidh Rannsachadh
Feedback
Ais-eòlas
Published by The Scottish Parliamentary Corporate Body
A Guide to Gross Value Added (GVA) in Scotland
Author: Alison O'Connor
SHARE
PDF
Published: Friday 23 Feb 2018 (SB 18-15)
Expand
Overview
Report
Hide
Hide
Overview
Report
Executive Summary
Introduction
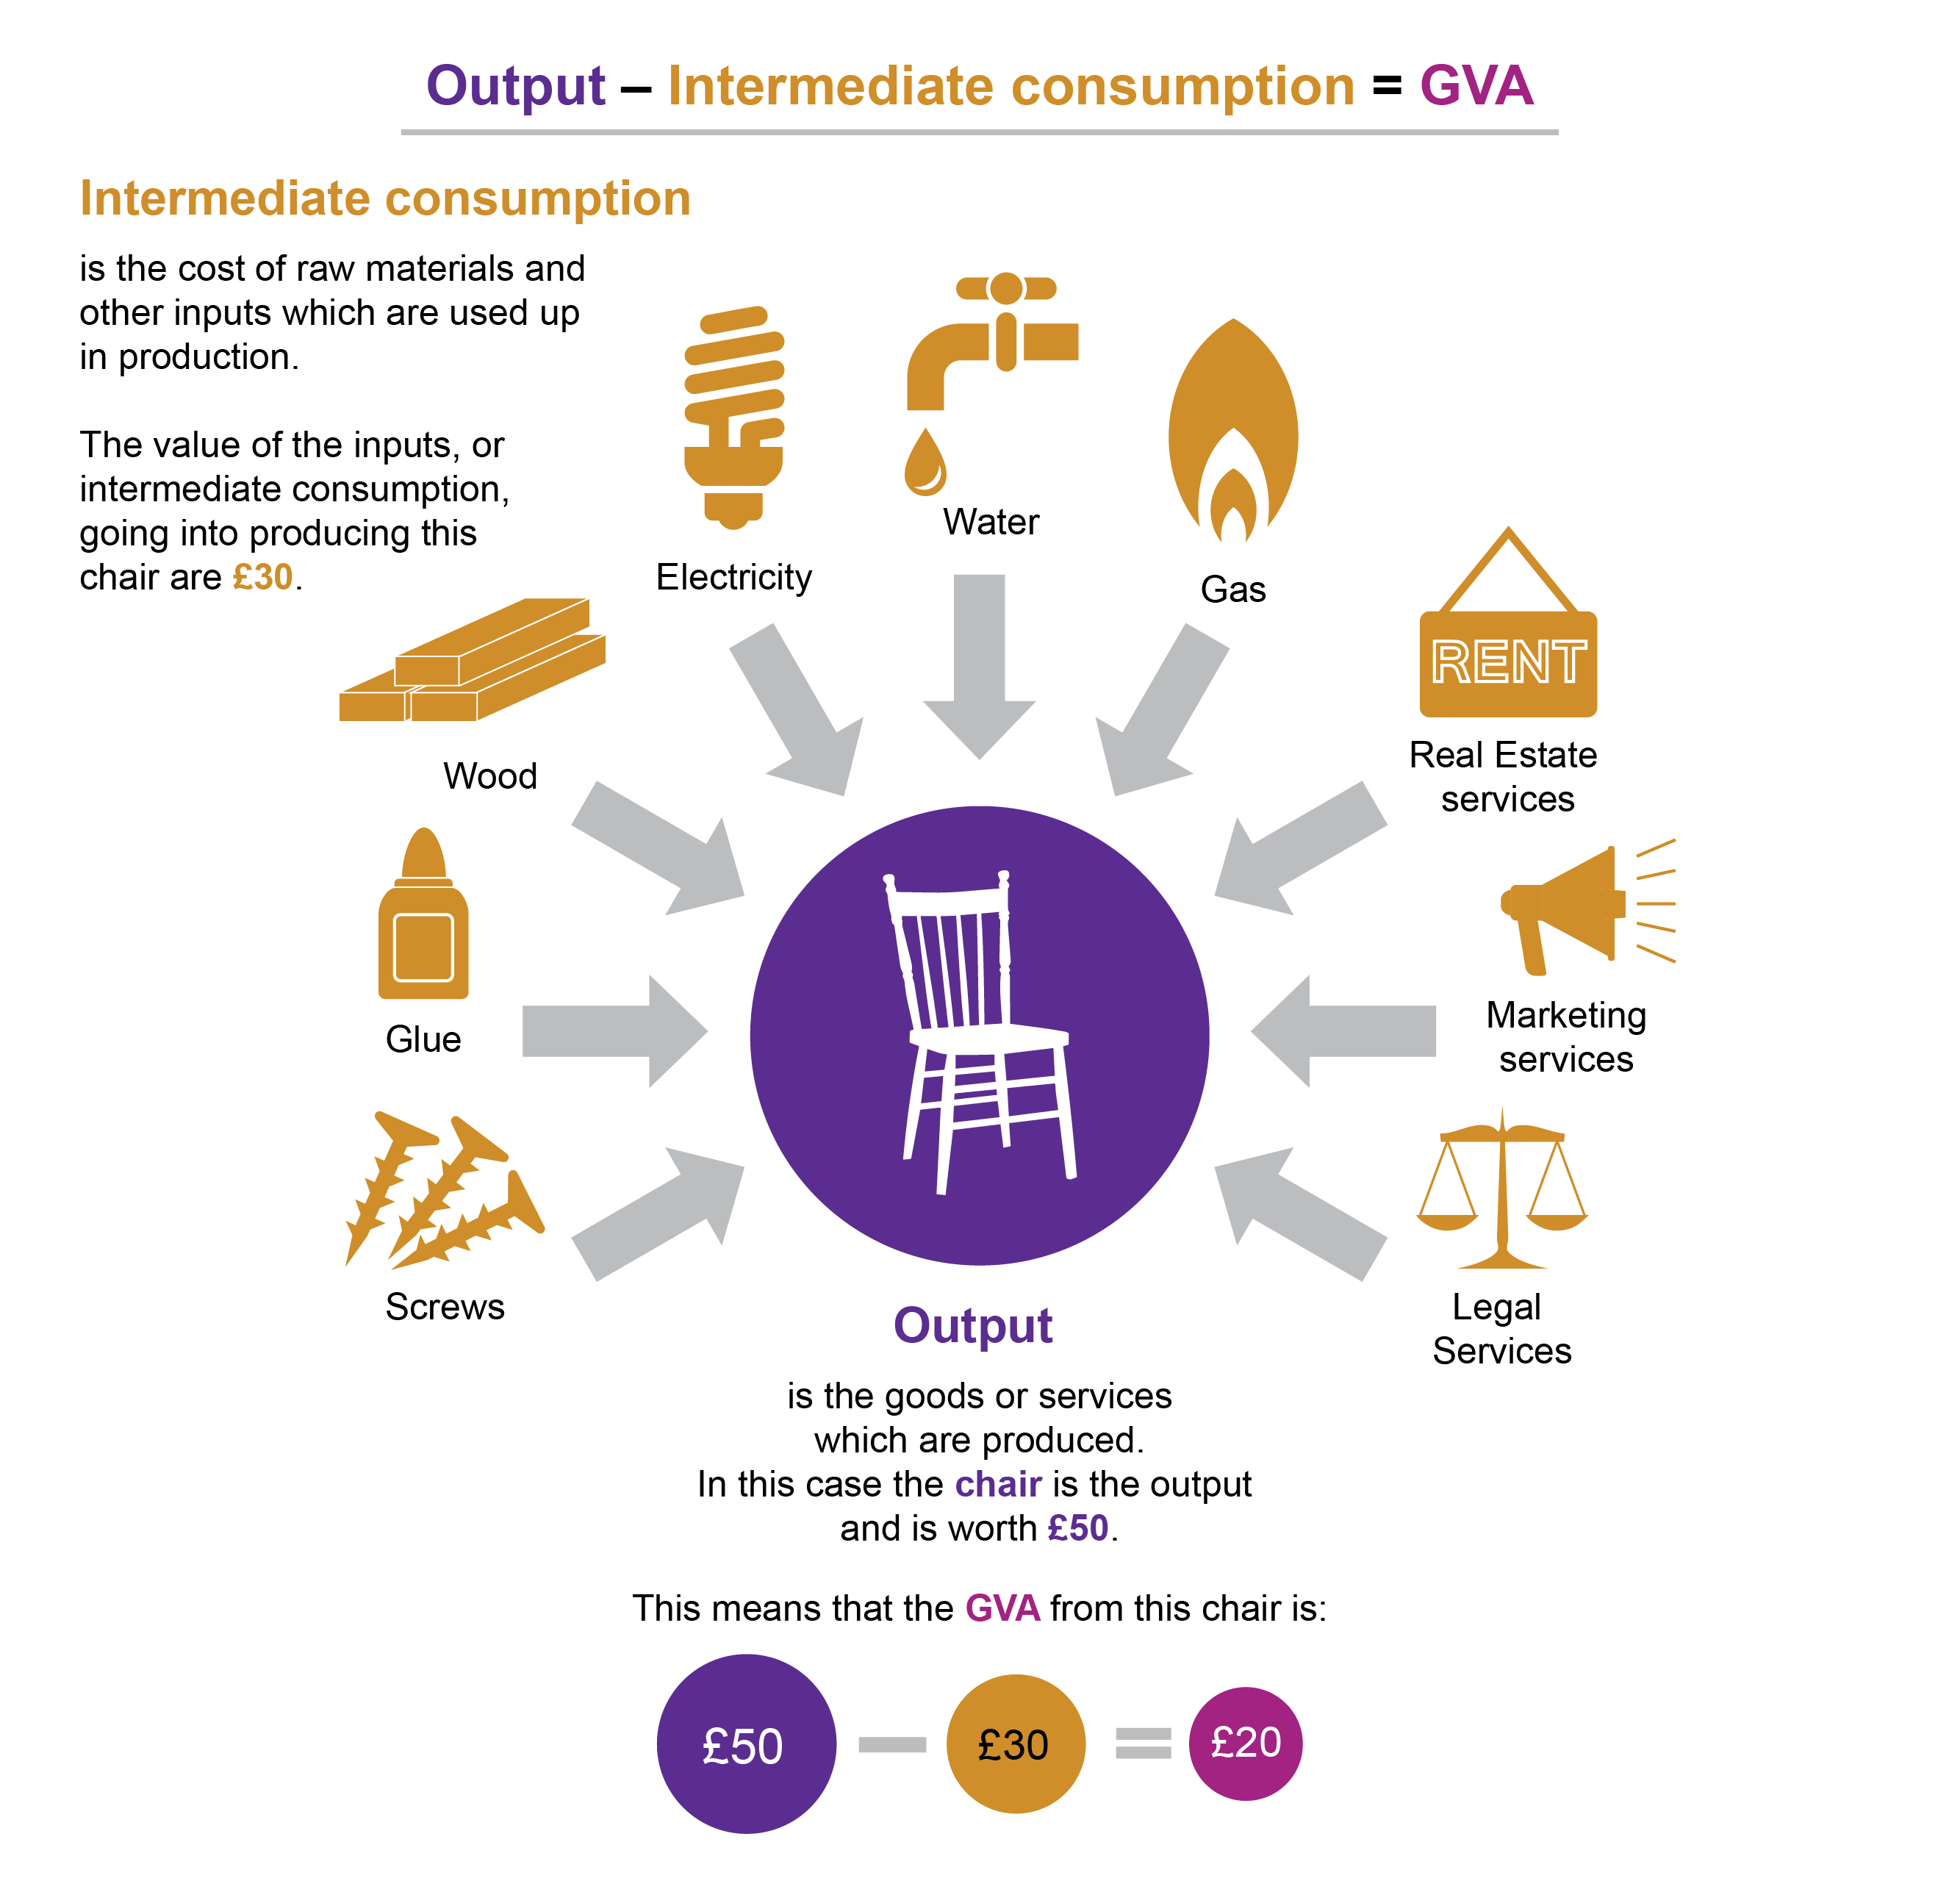
What is Gross Value Added (GVA)?
Why is GVA important?
Measuring GVA
Issues with GVA
Data sources and glossary
Glossary
GVA and the policy landscape
Scotland's Economic Strategy
Relevant themes
Previous economic strategies
Working with others
GVA performance
Other policy
Scotland - big picture GVA
Current GVA snapshot
GVA trends overtime
Focus on industry GVA
Top level sector overview
Detailed sector insight
Sector snapshots
Sectoral turnover to GVA ratios
Manufacturing
Manufacturing sub-sectors
Scotland's regional spread of GVA
Local authority GVA
NUTS 3 level
City region example
Industry variation by region
Components of GVA
Income components of GVA
Gross operating surplus
Annex A: Data and technical notes
Data sources
Other GVA data sources
Methodology and data interpretation notes
Sources
Image: What is Gross Value Added (GVA)?
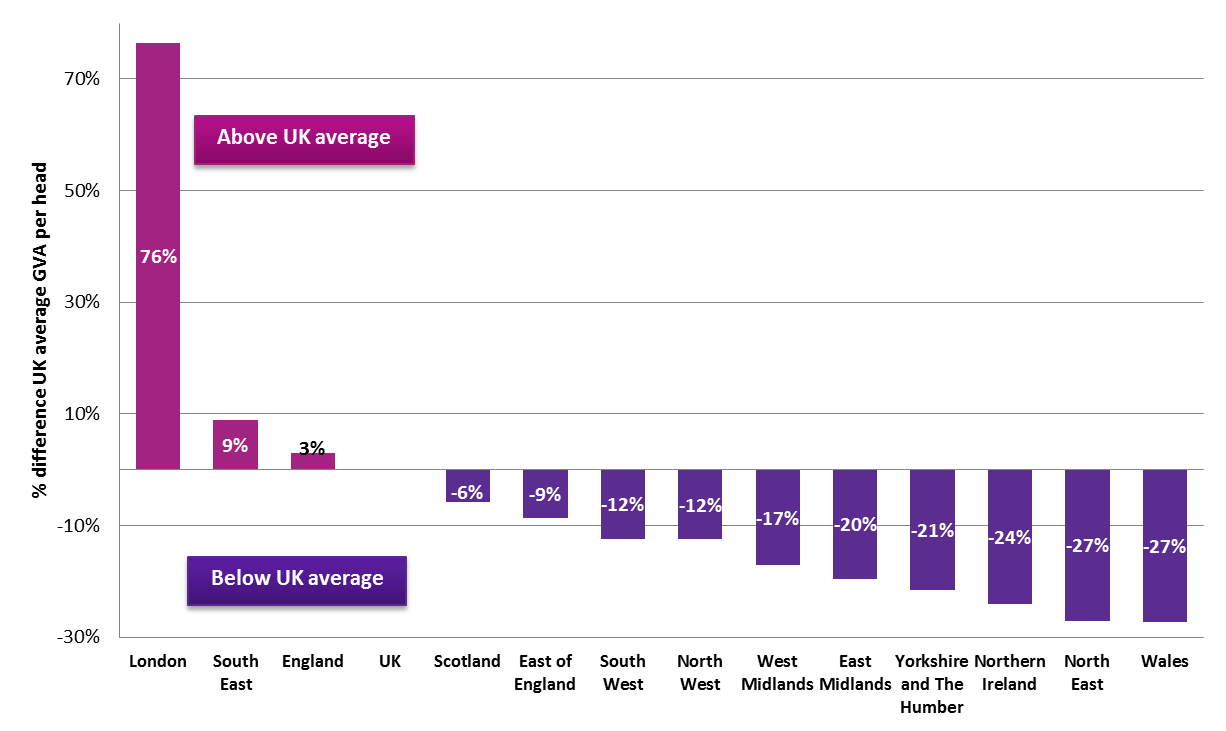
Image: Figure 1: Countries and regions GVA per head relative to UK average, 2016
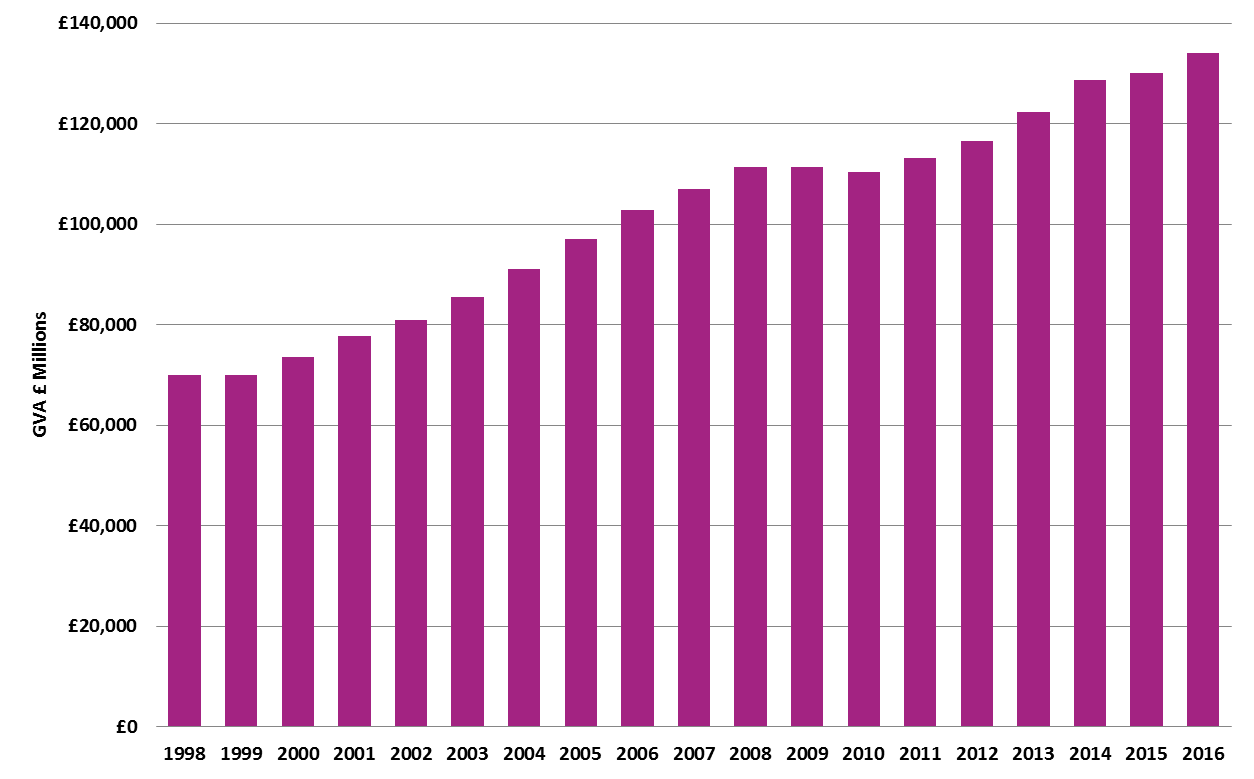
Image: Figure 2: Scotland GVA, current basic prices, 1998-2016
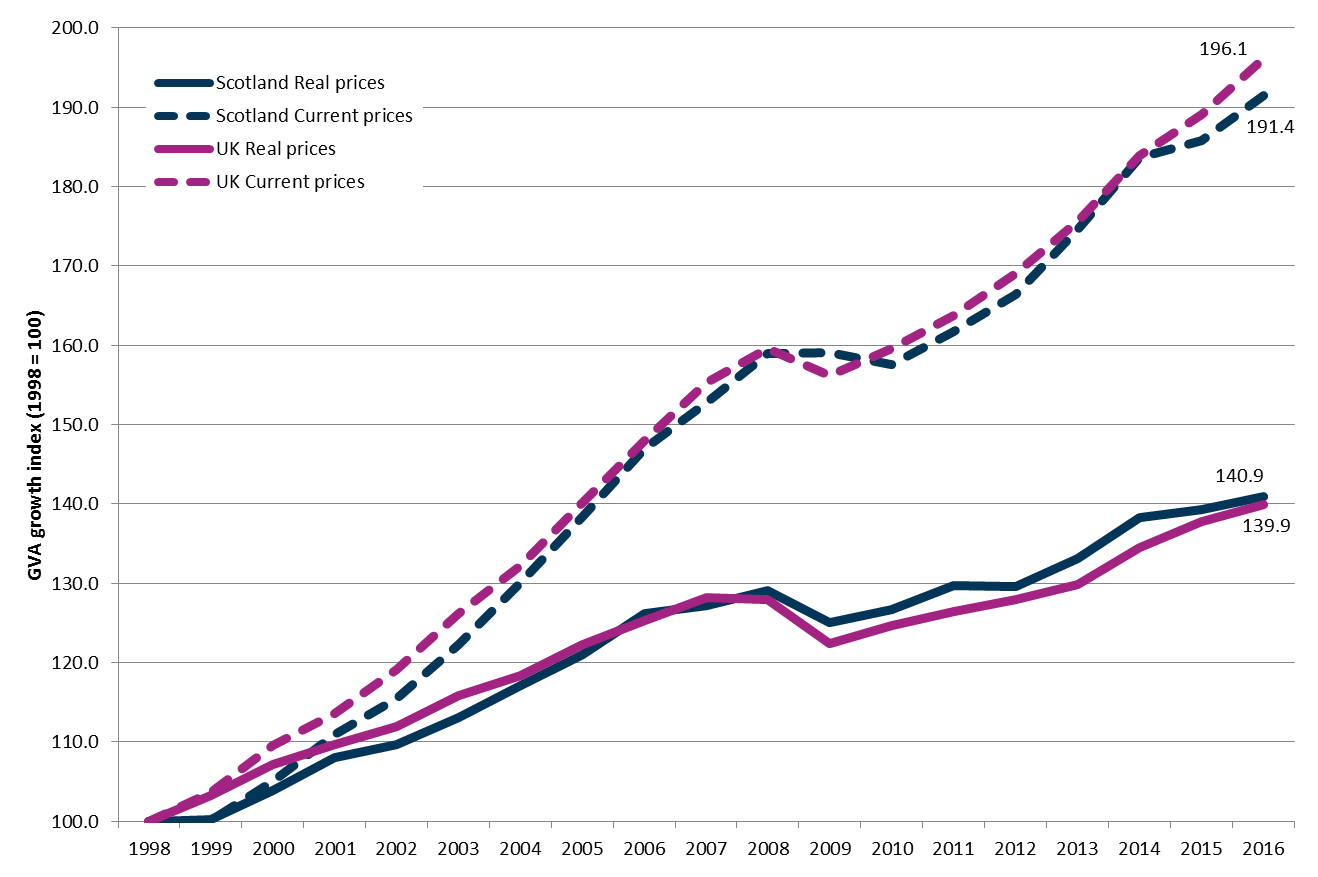
Image: Figure 3: Scotland GVA growth - current prices versus real prices, 1998 - 2016
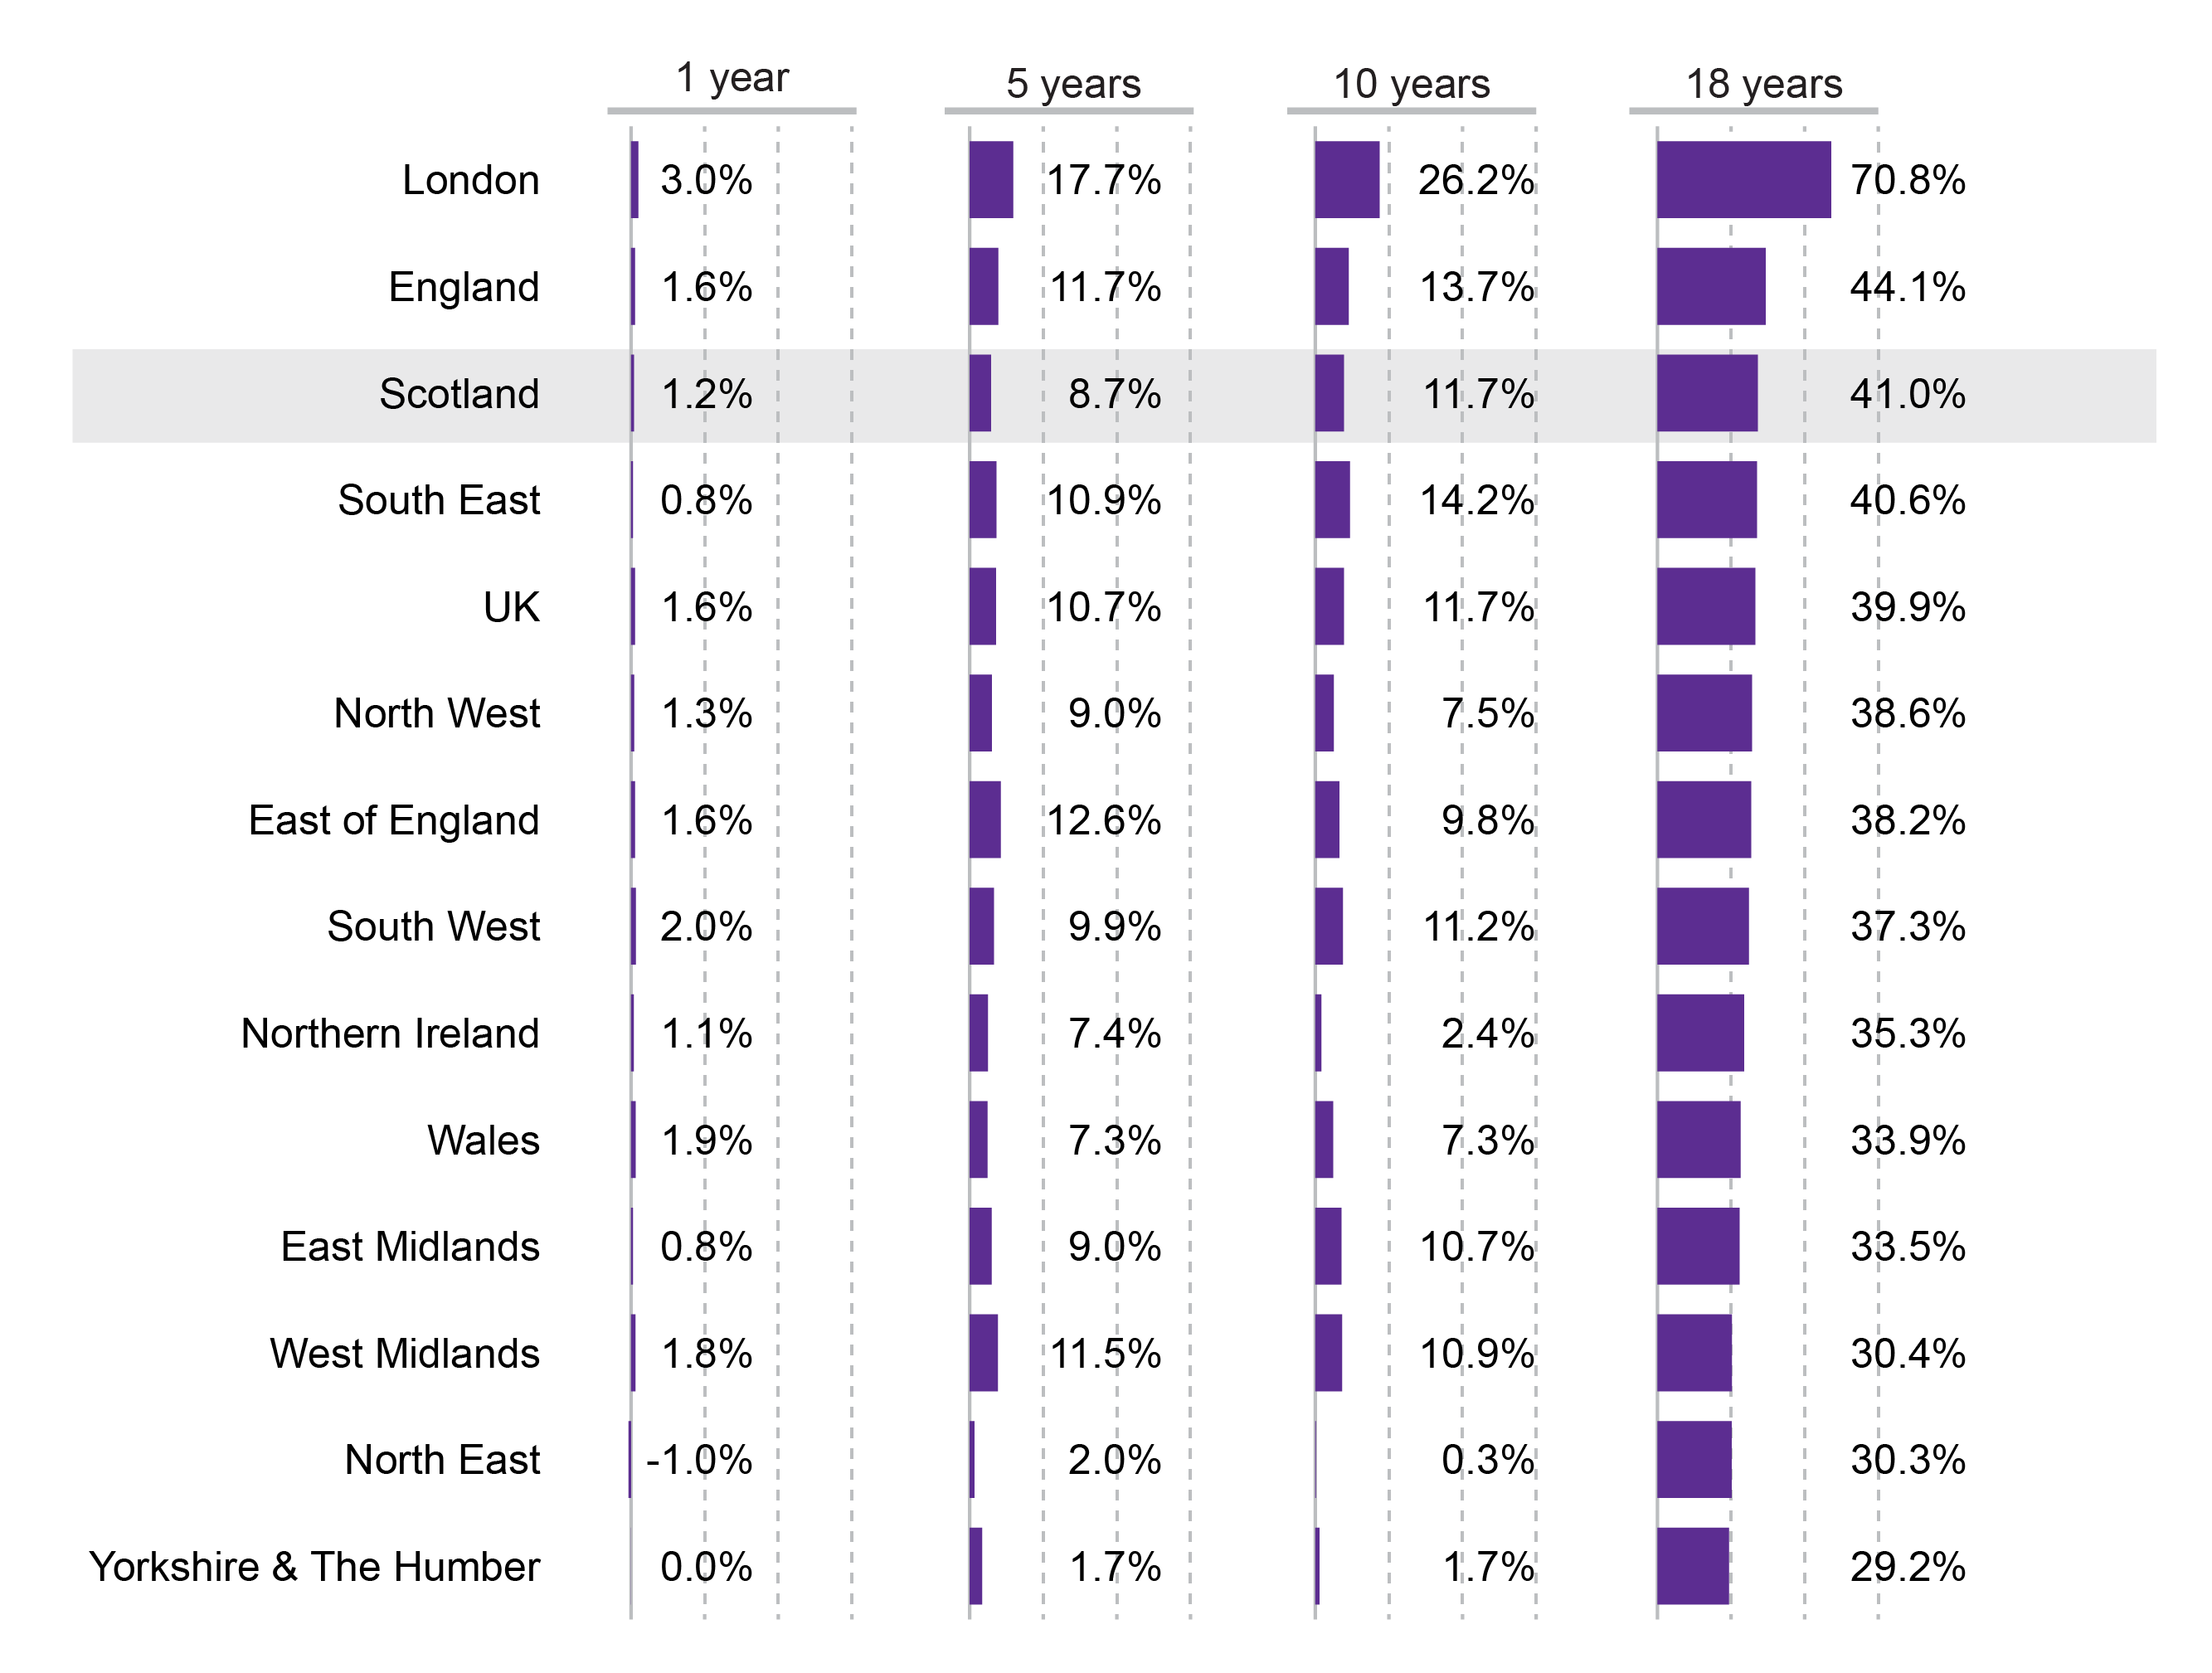
Image: Figure 4: Country and region real GVA growth (1-year, 5-year, 10-year, 18-year), 1998 - 2016
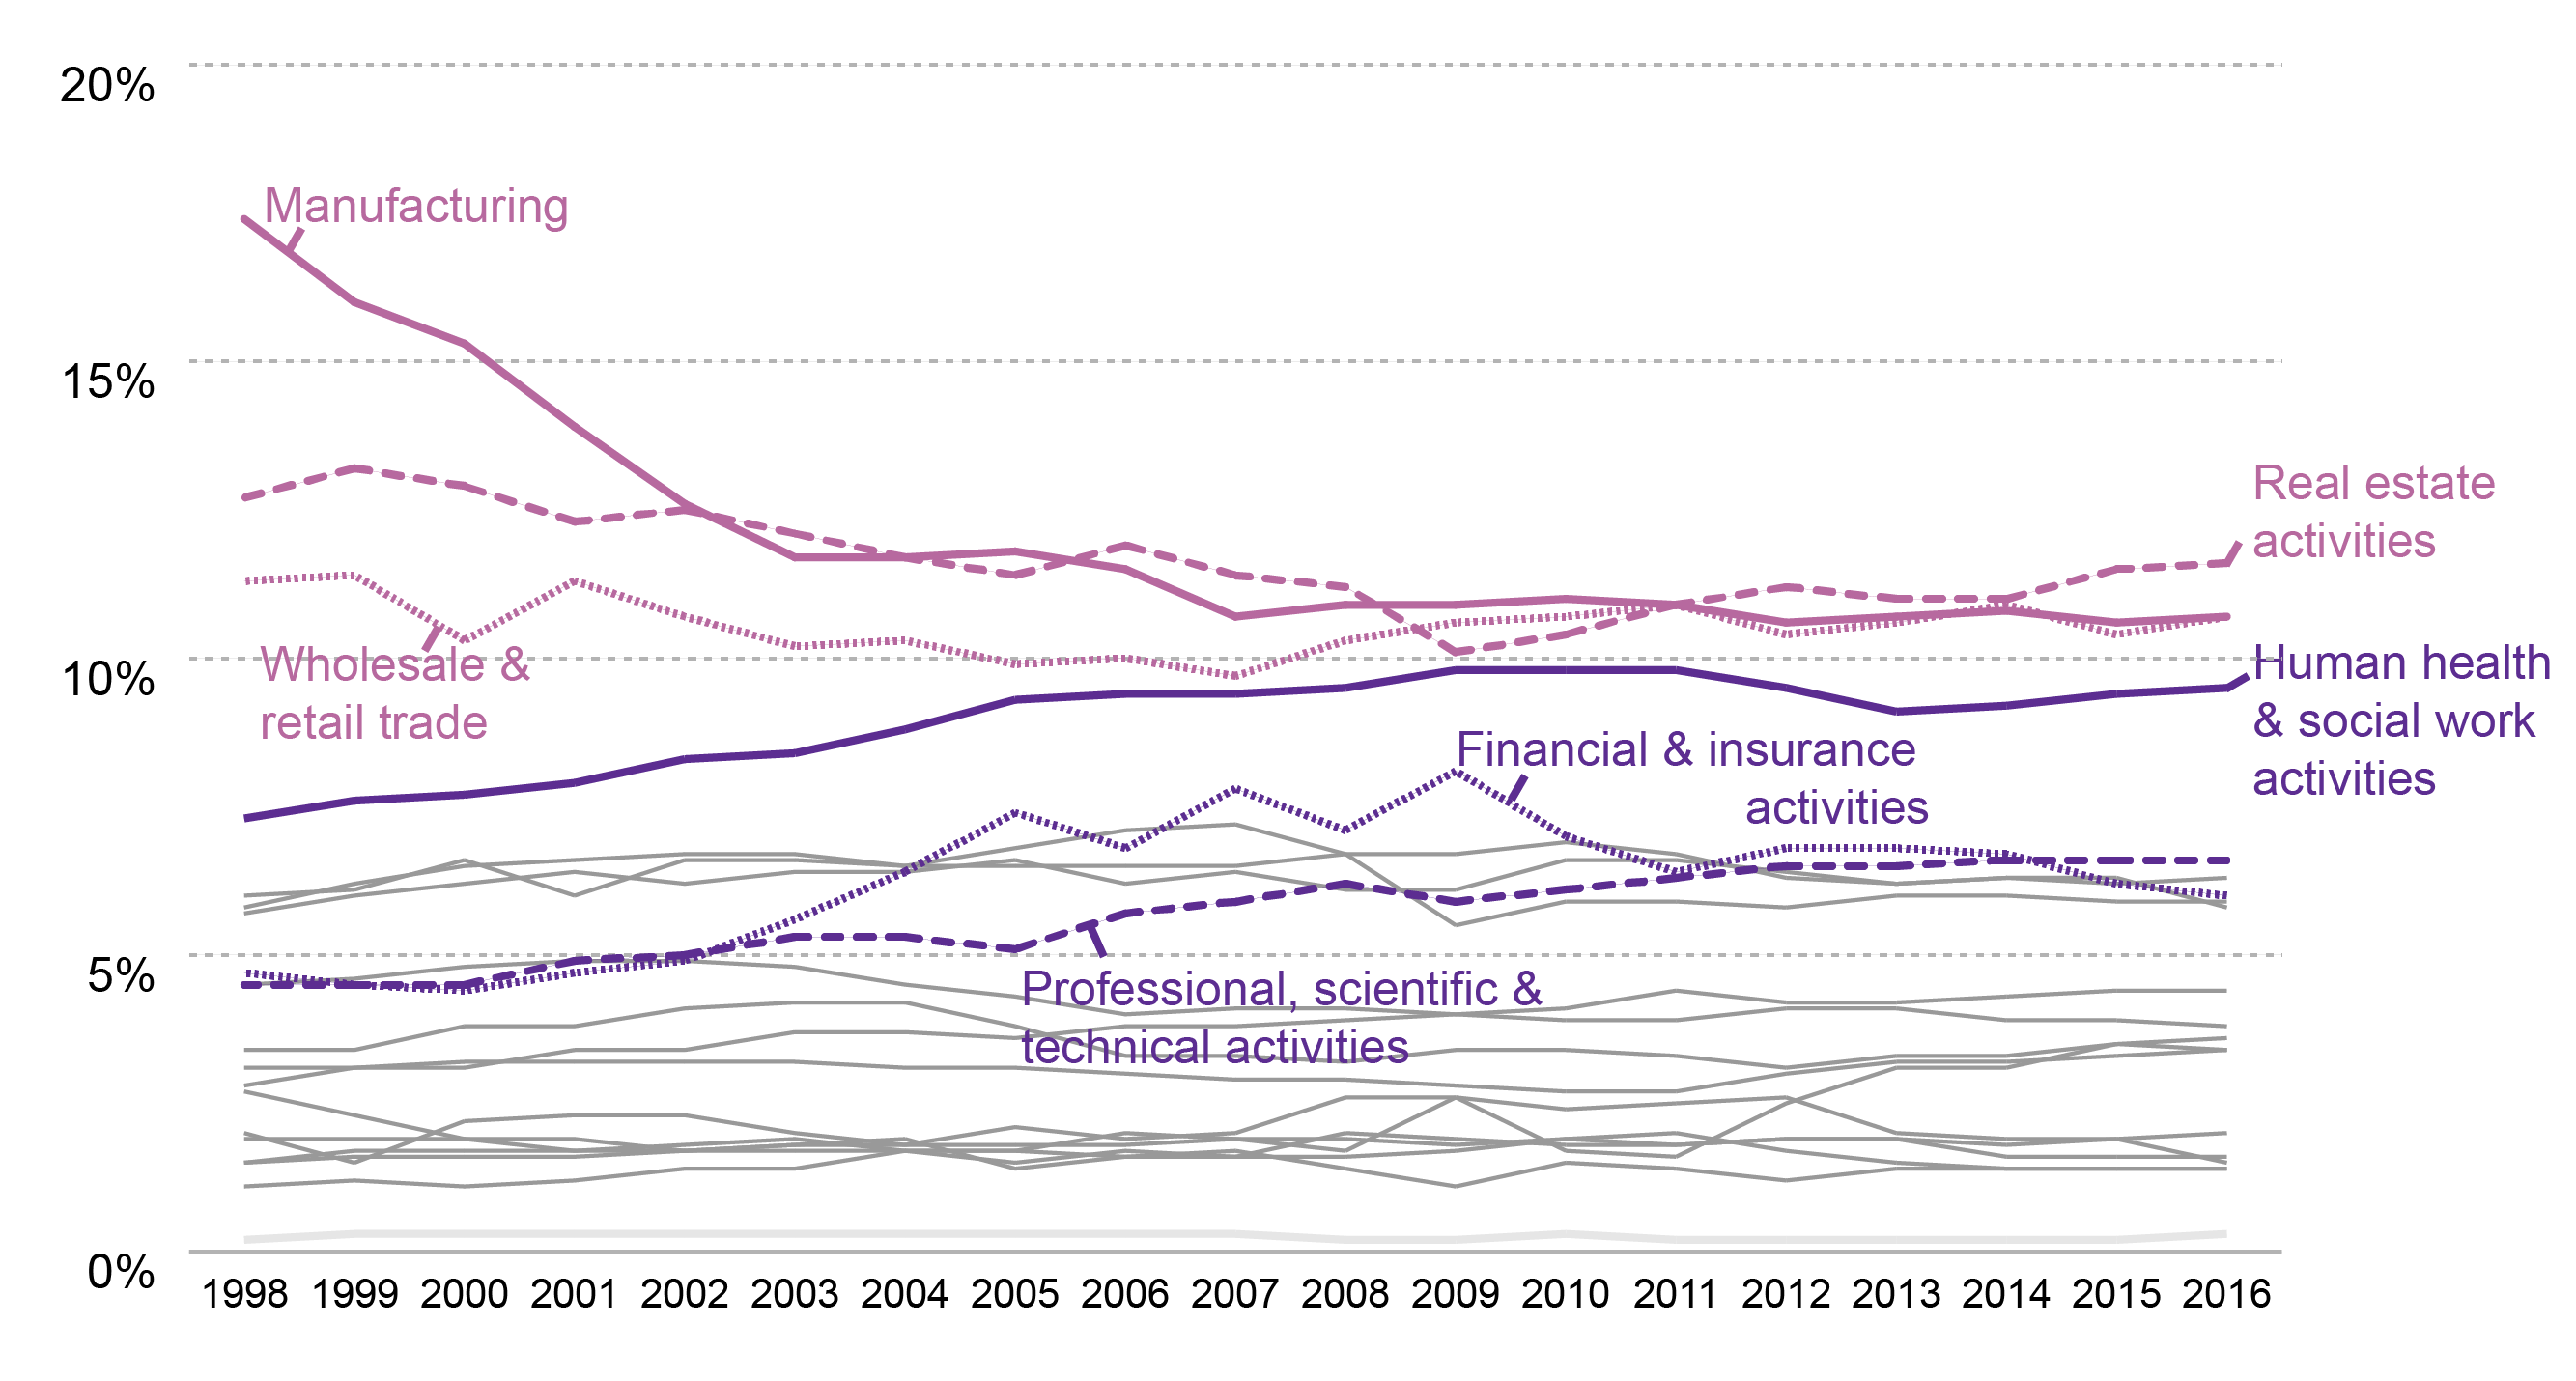
Image: Figure 5: Broad sector contribution to total Scottish GVA, 1998-2016
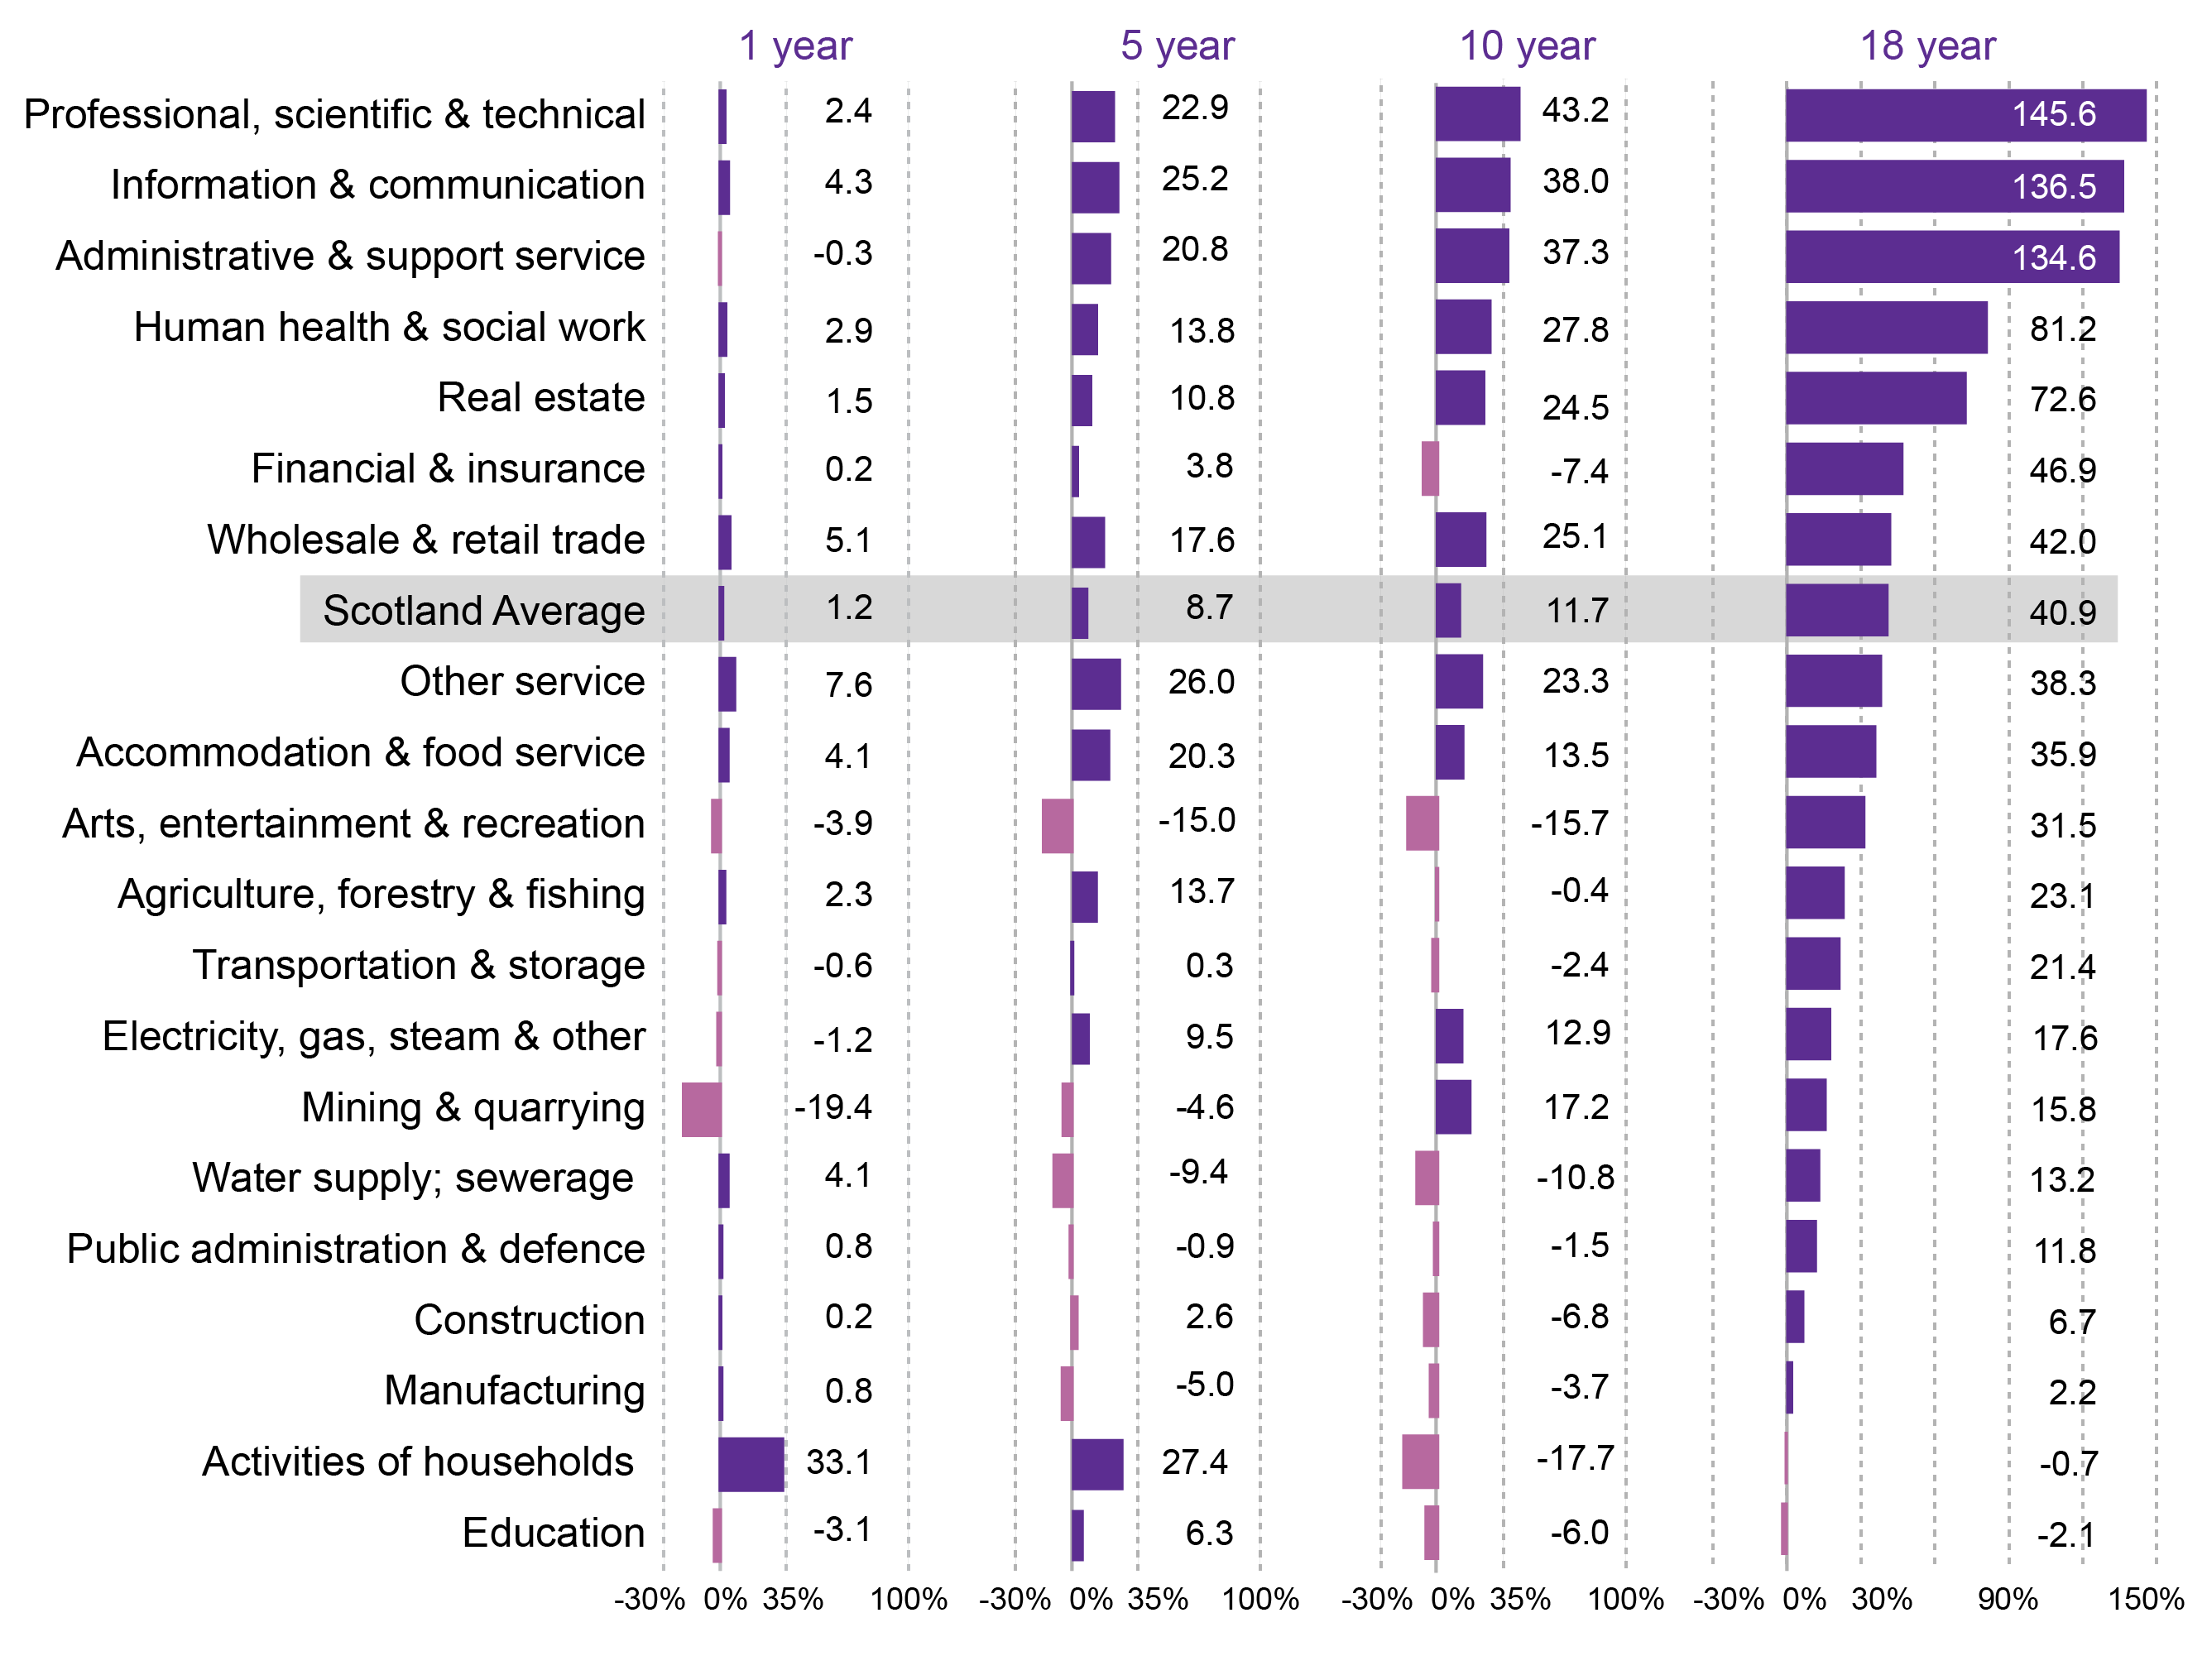
Image: Figure 6: GVA growth rates by broad sector (%) - real terms
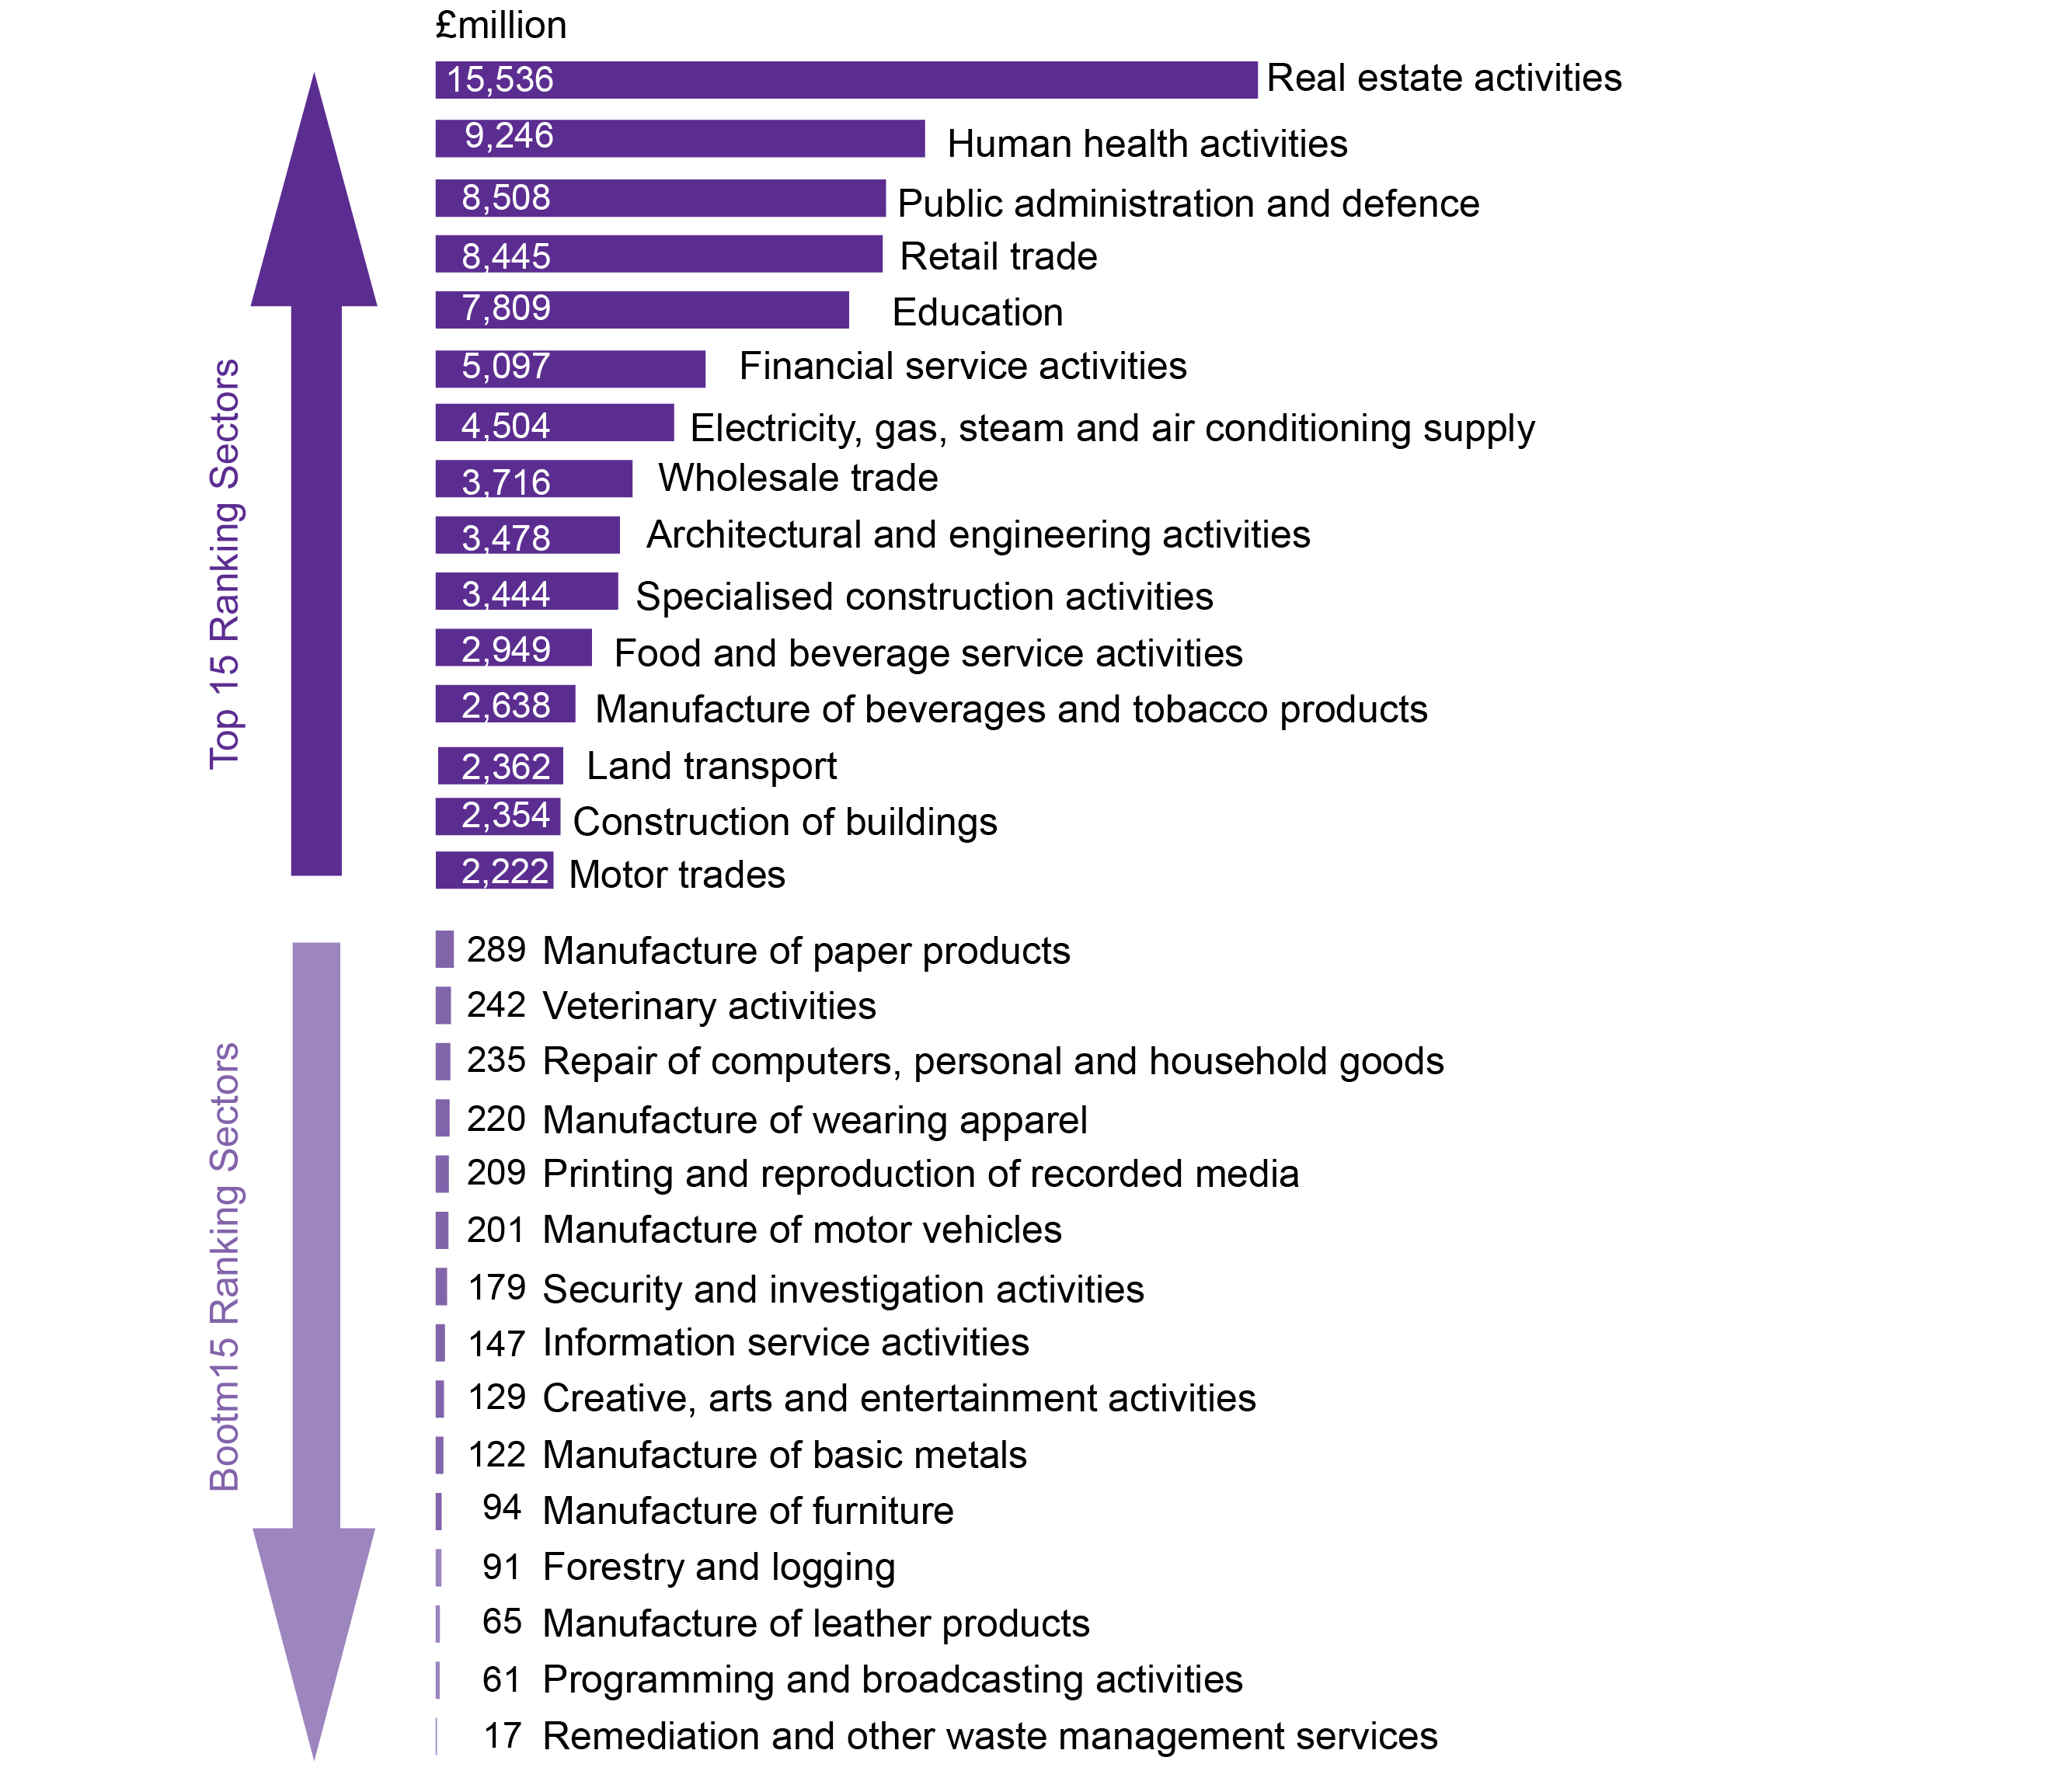
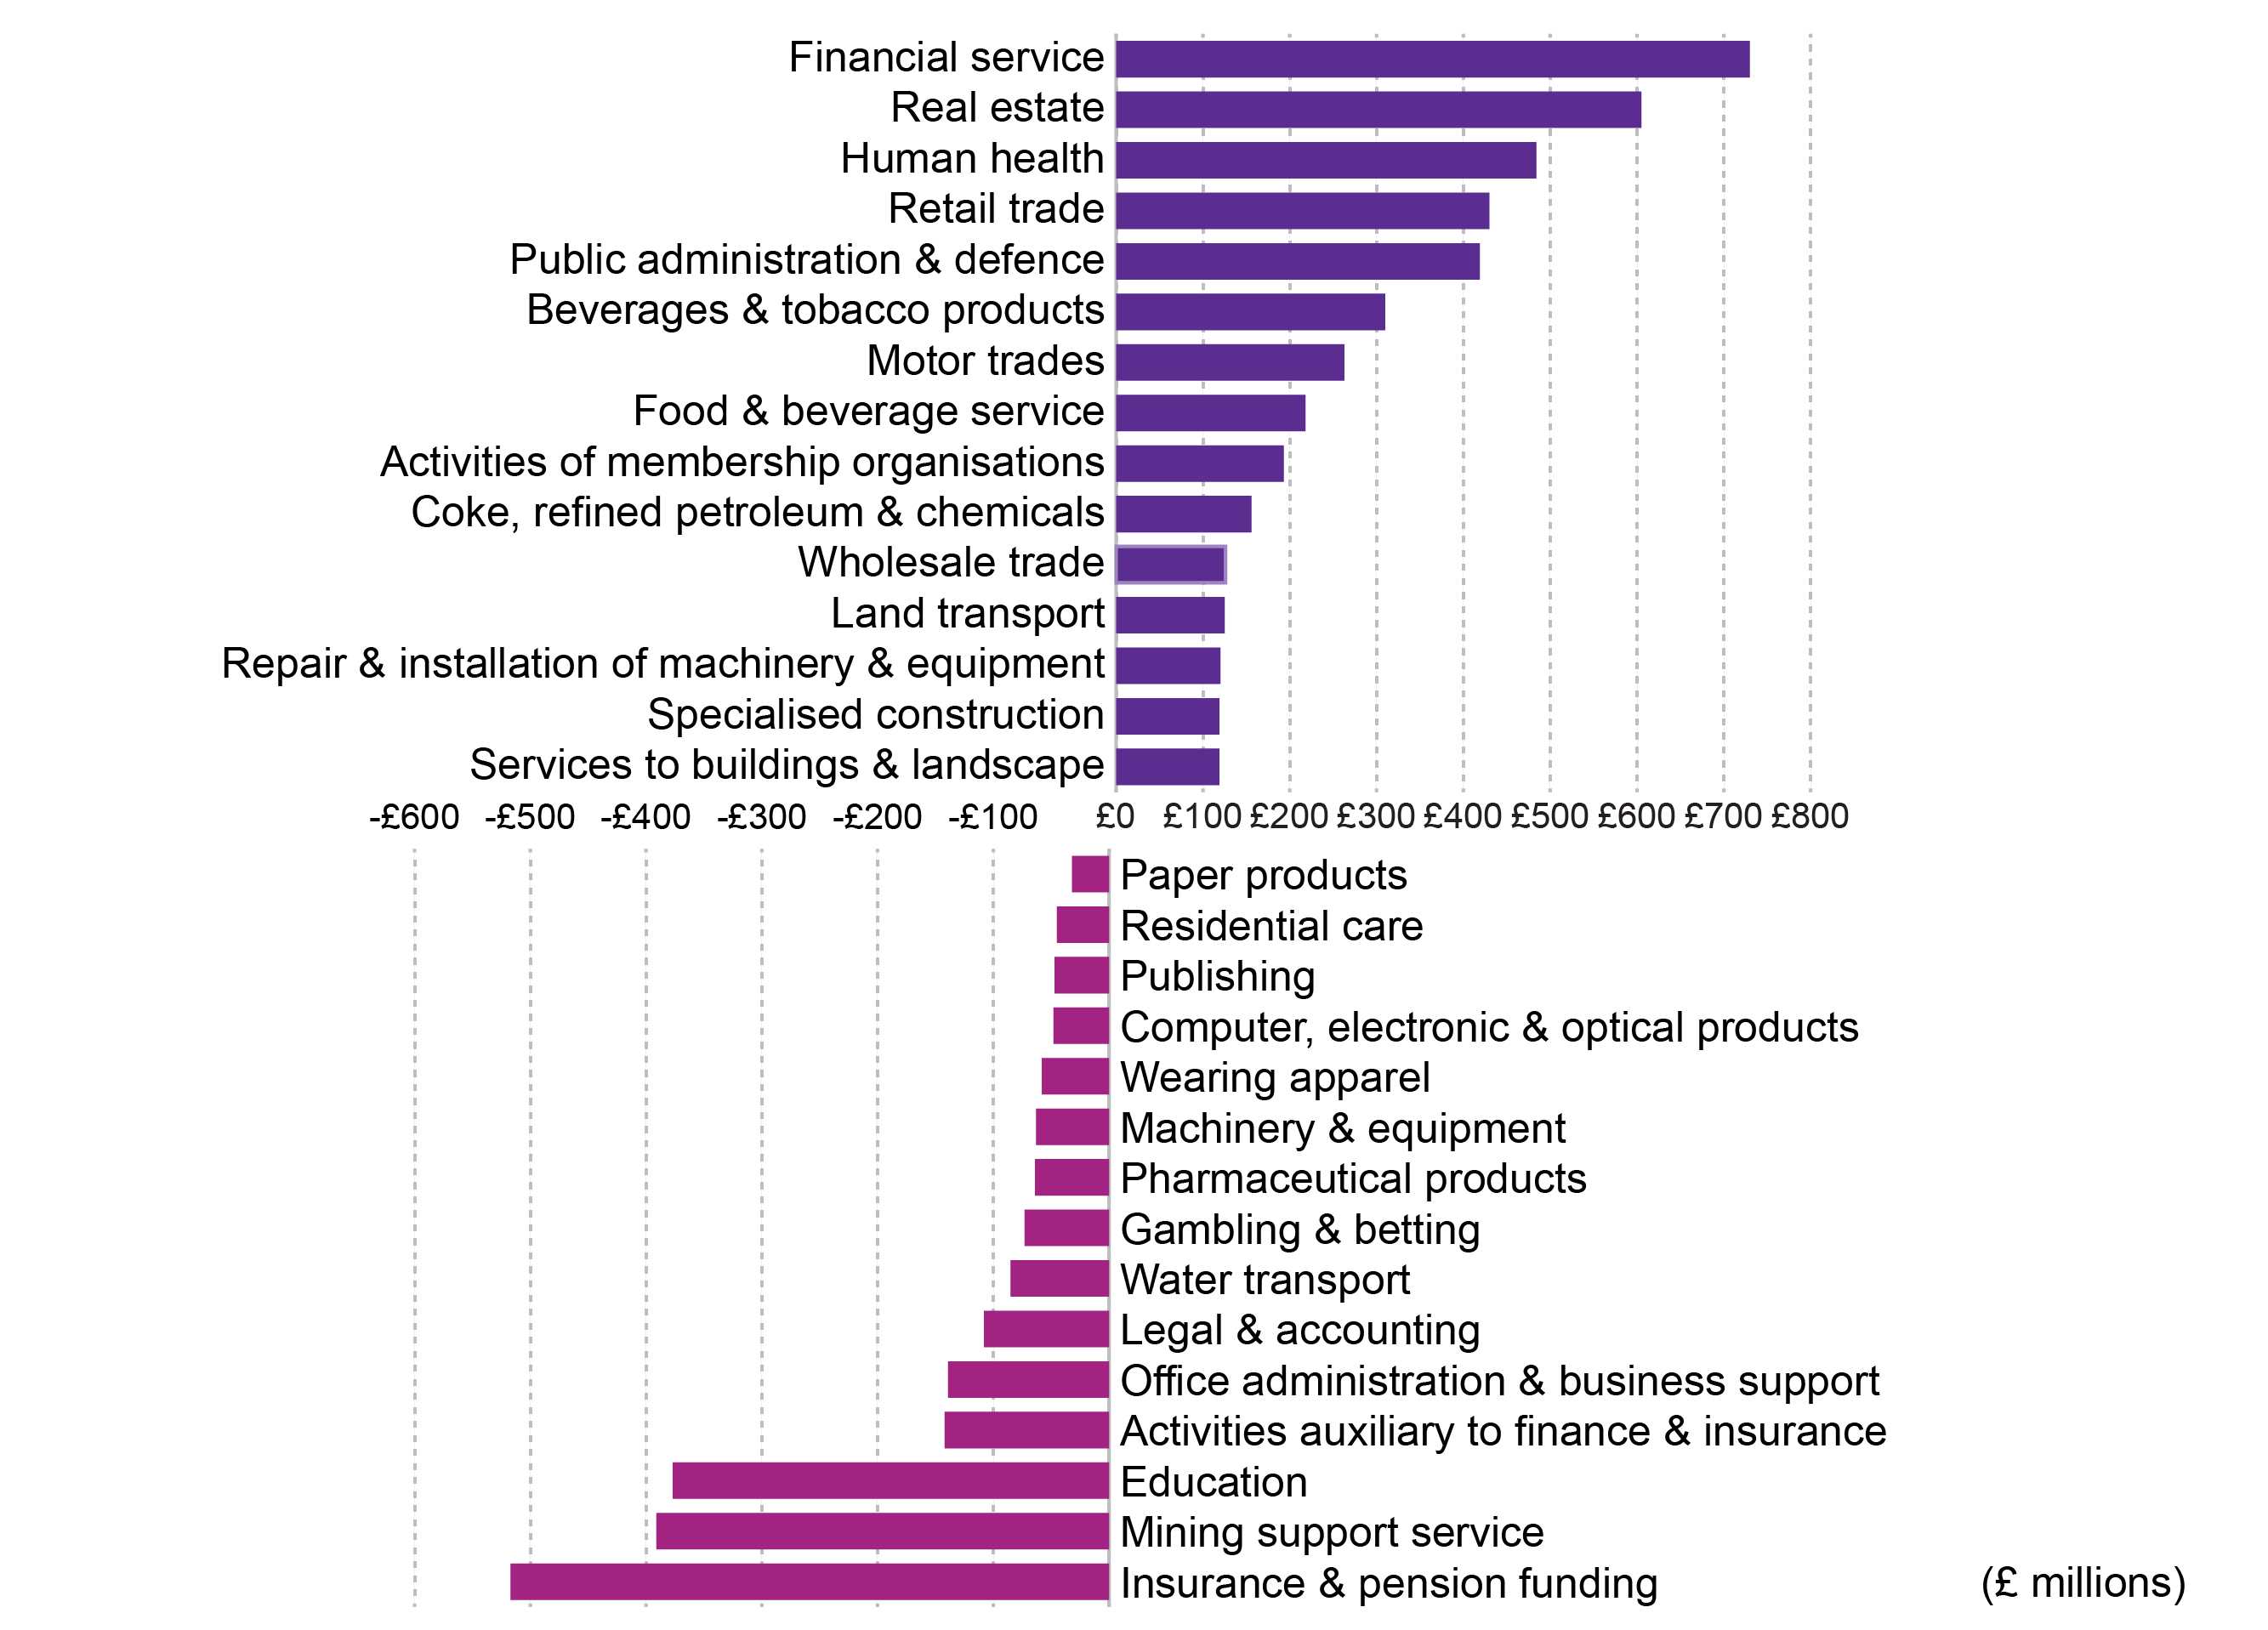
Image: Figure 7: Top and bottom ranking 2-digit SIC sectors for GVA (absolute terms), 2016
Image: Figure 8: 2-digit SIC sectors by absolute growth in GVA, 2016 (£ millions)
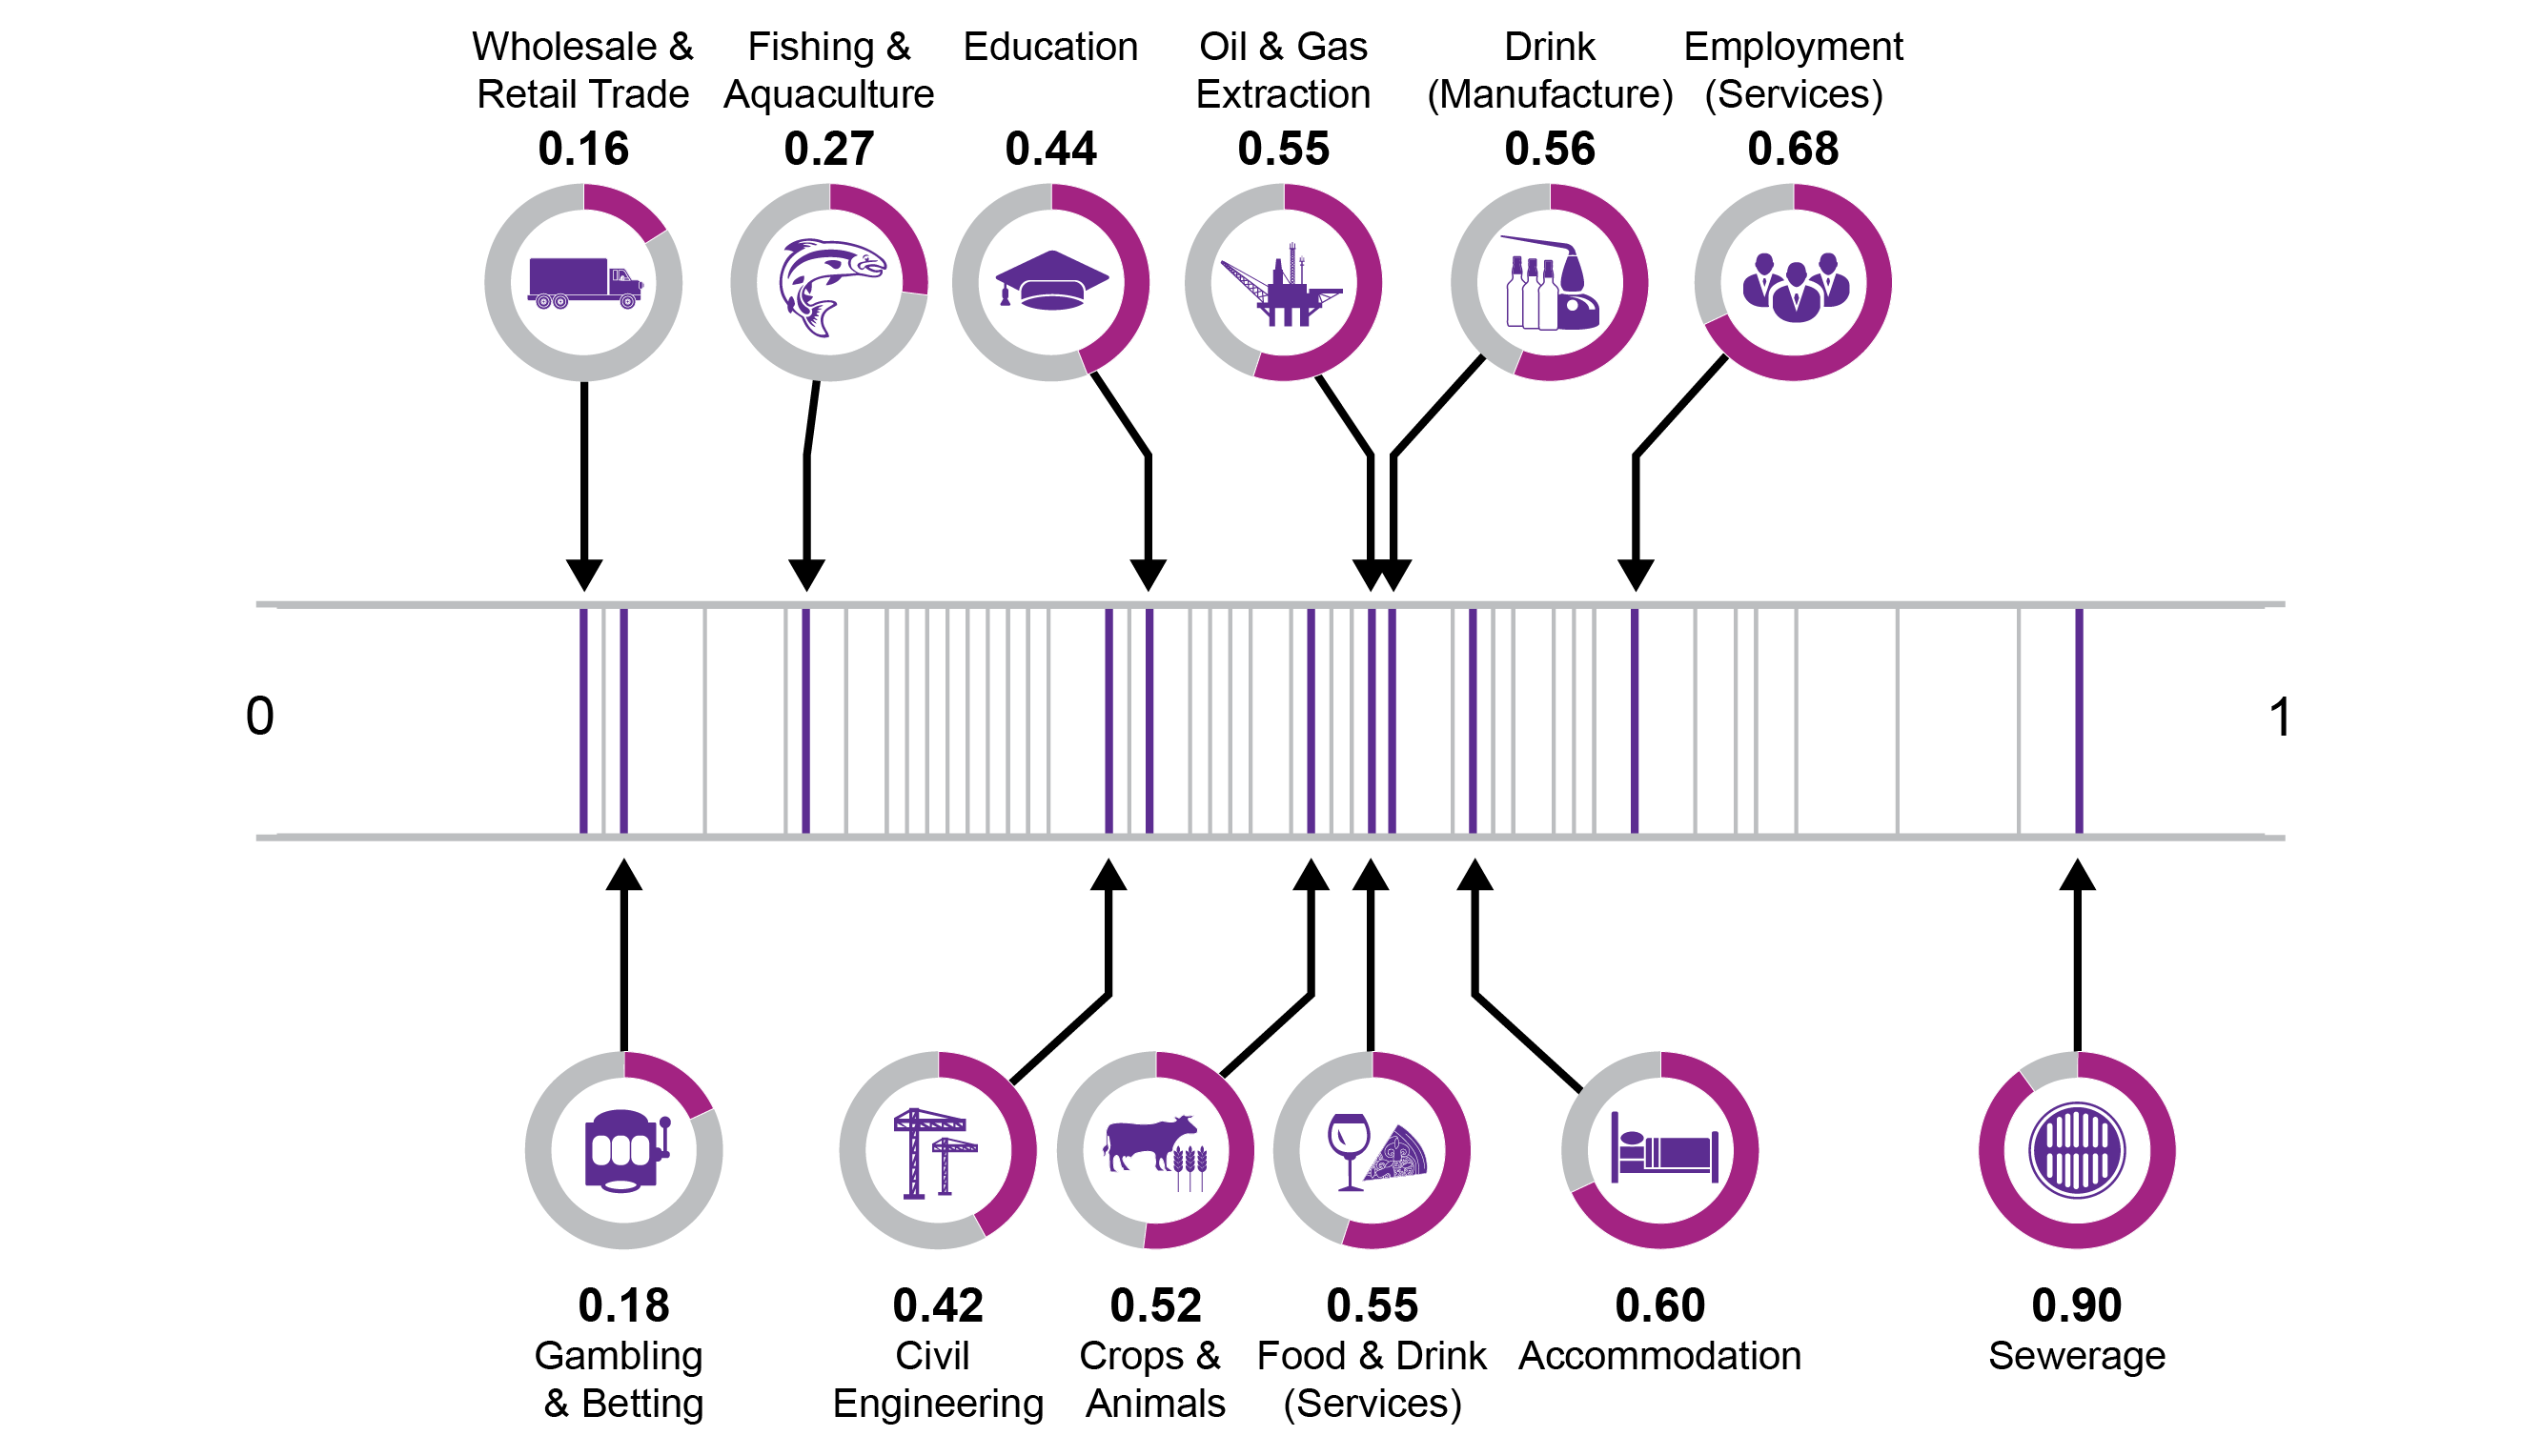
Image: Figure 9: Turnover to GVA ratios by sector, 2015
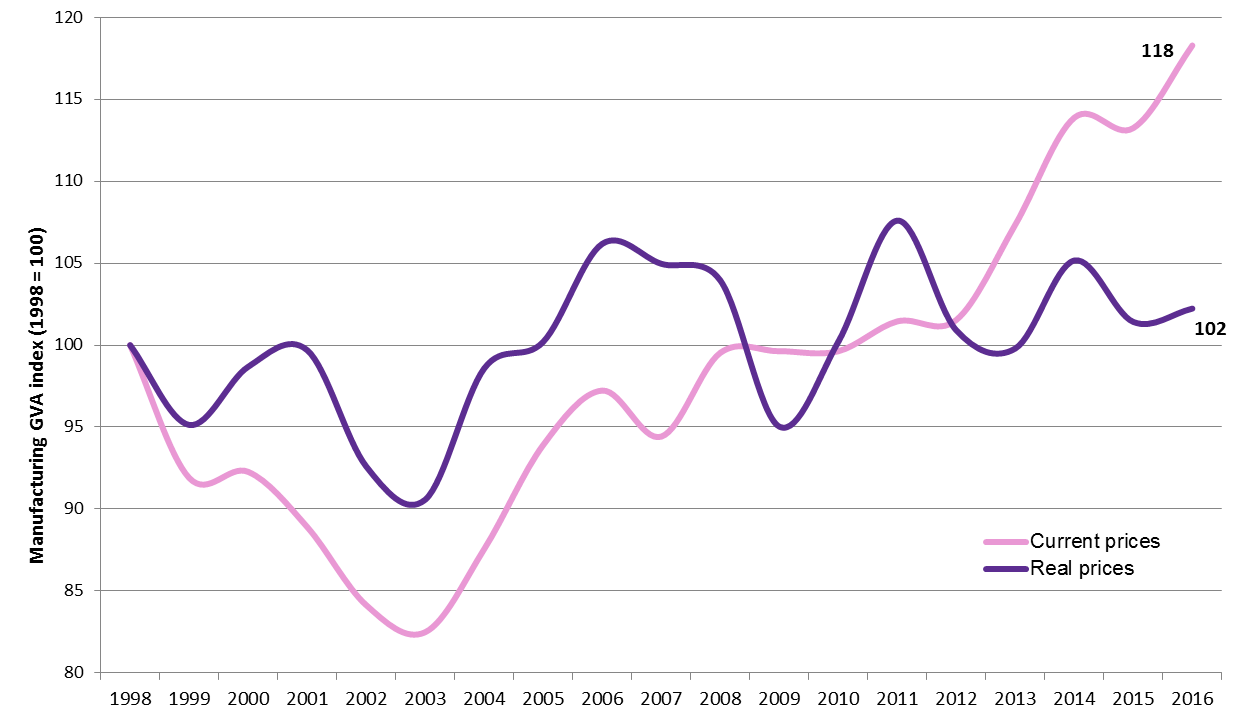
Image: Figure 10: Scottish manufacturing GVA index, real and current prices, 1998 to 2016
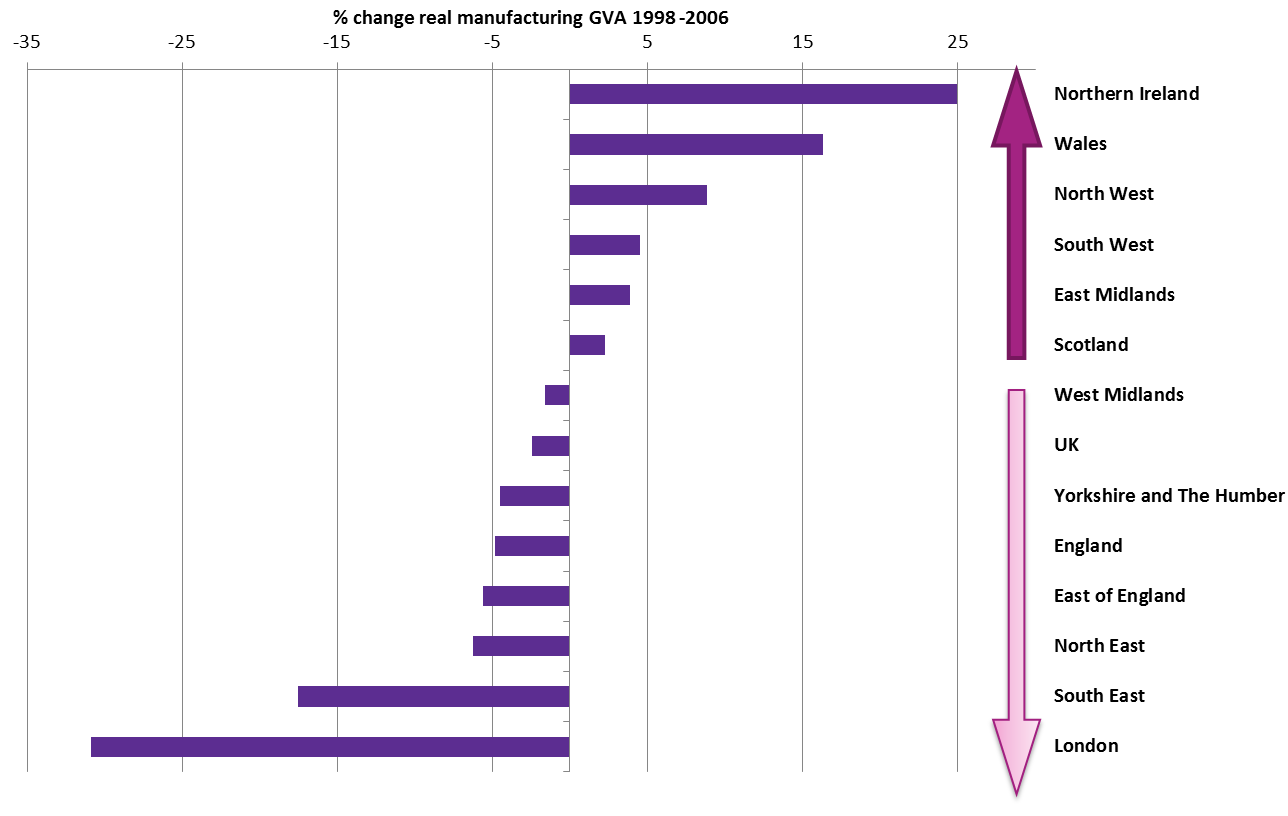
Image: Figure 11: Change in real manufacturing GVA, UK nations & regions, 1998 to 2016
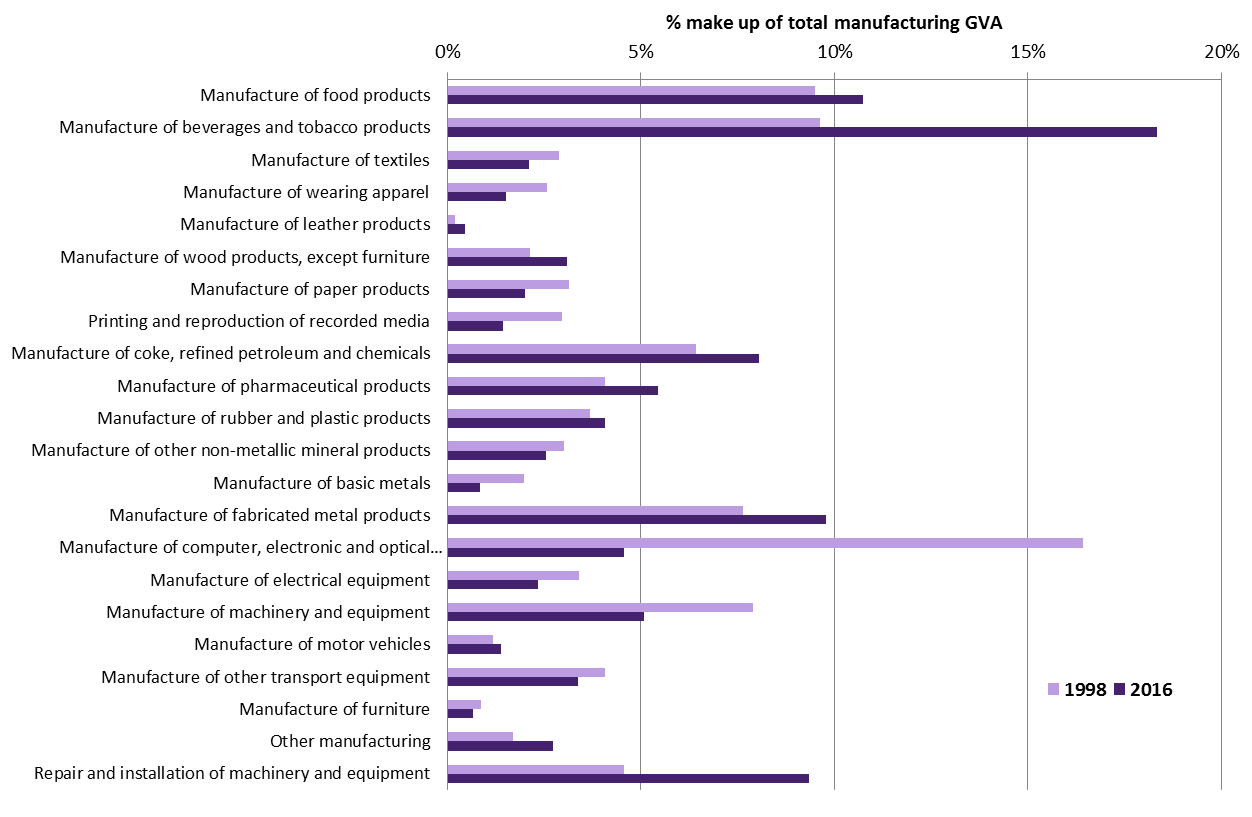
Image: Figure 12: Manufacturing GVA - percentage make up by sub-sector, 1998 and 2016
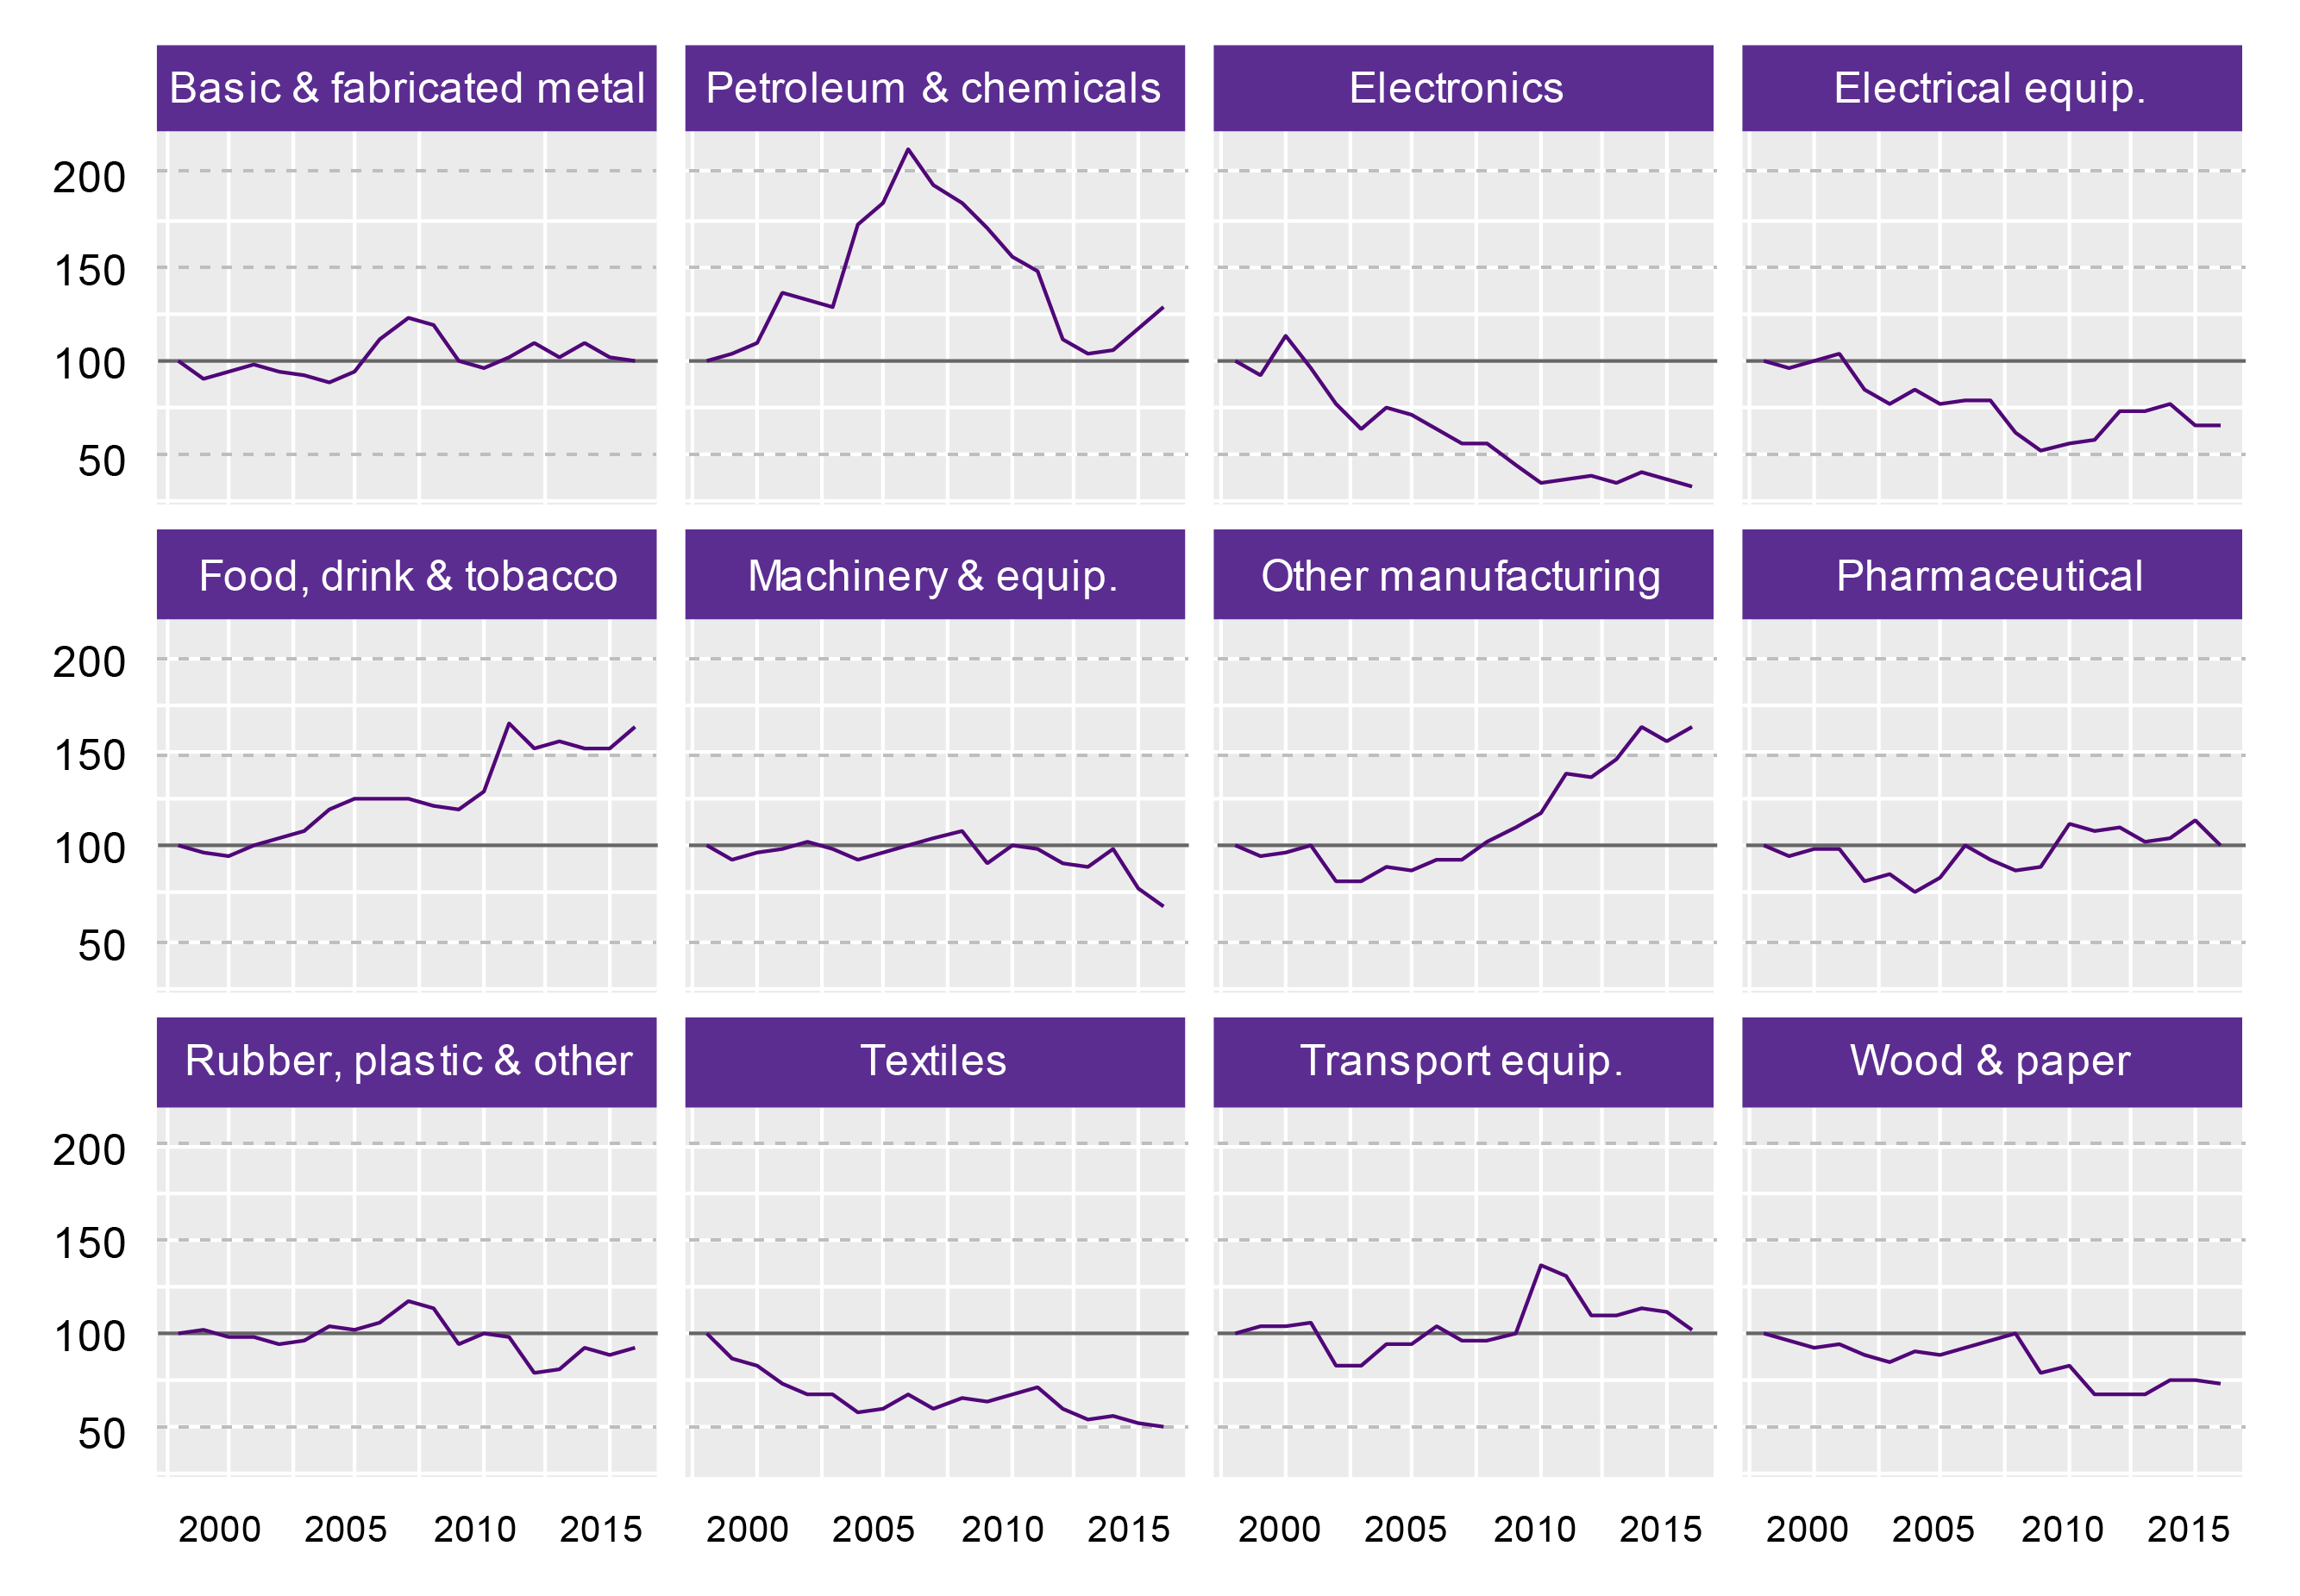
Image: Figure 13: Manufacturing sub-sector Scotland, real GVA index (1998=100)
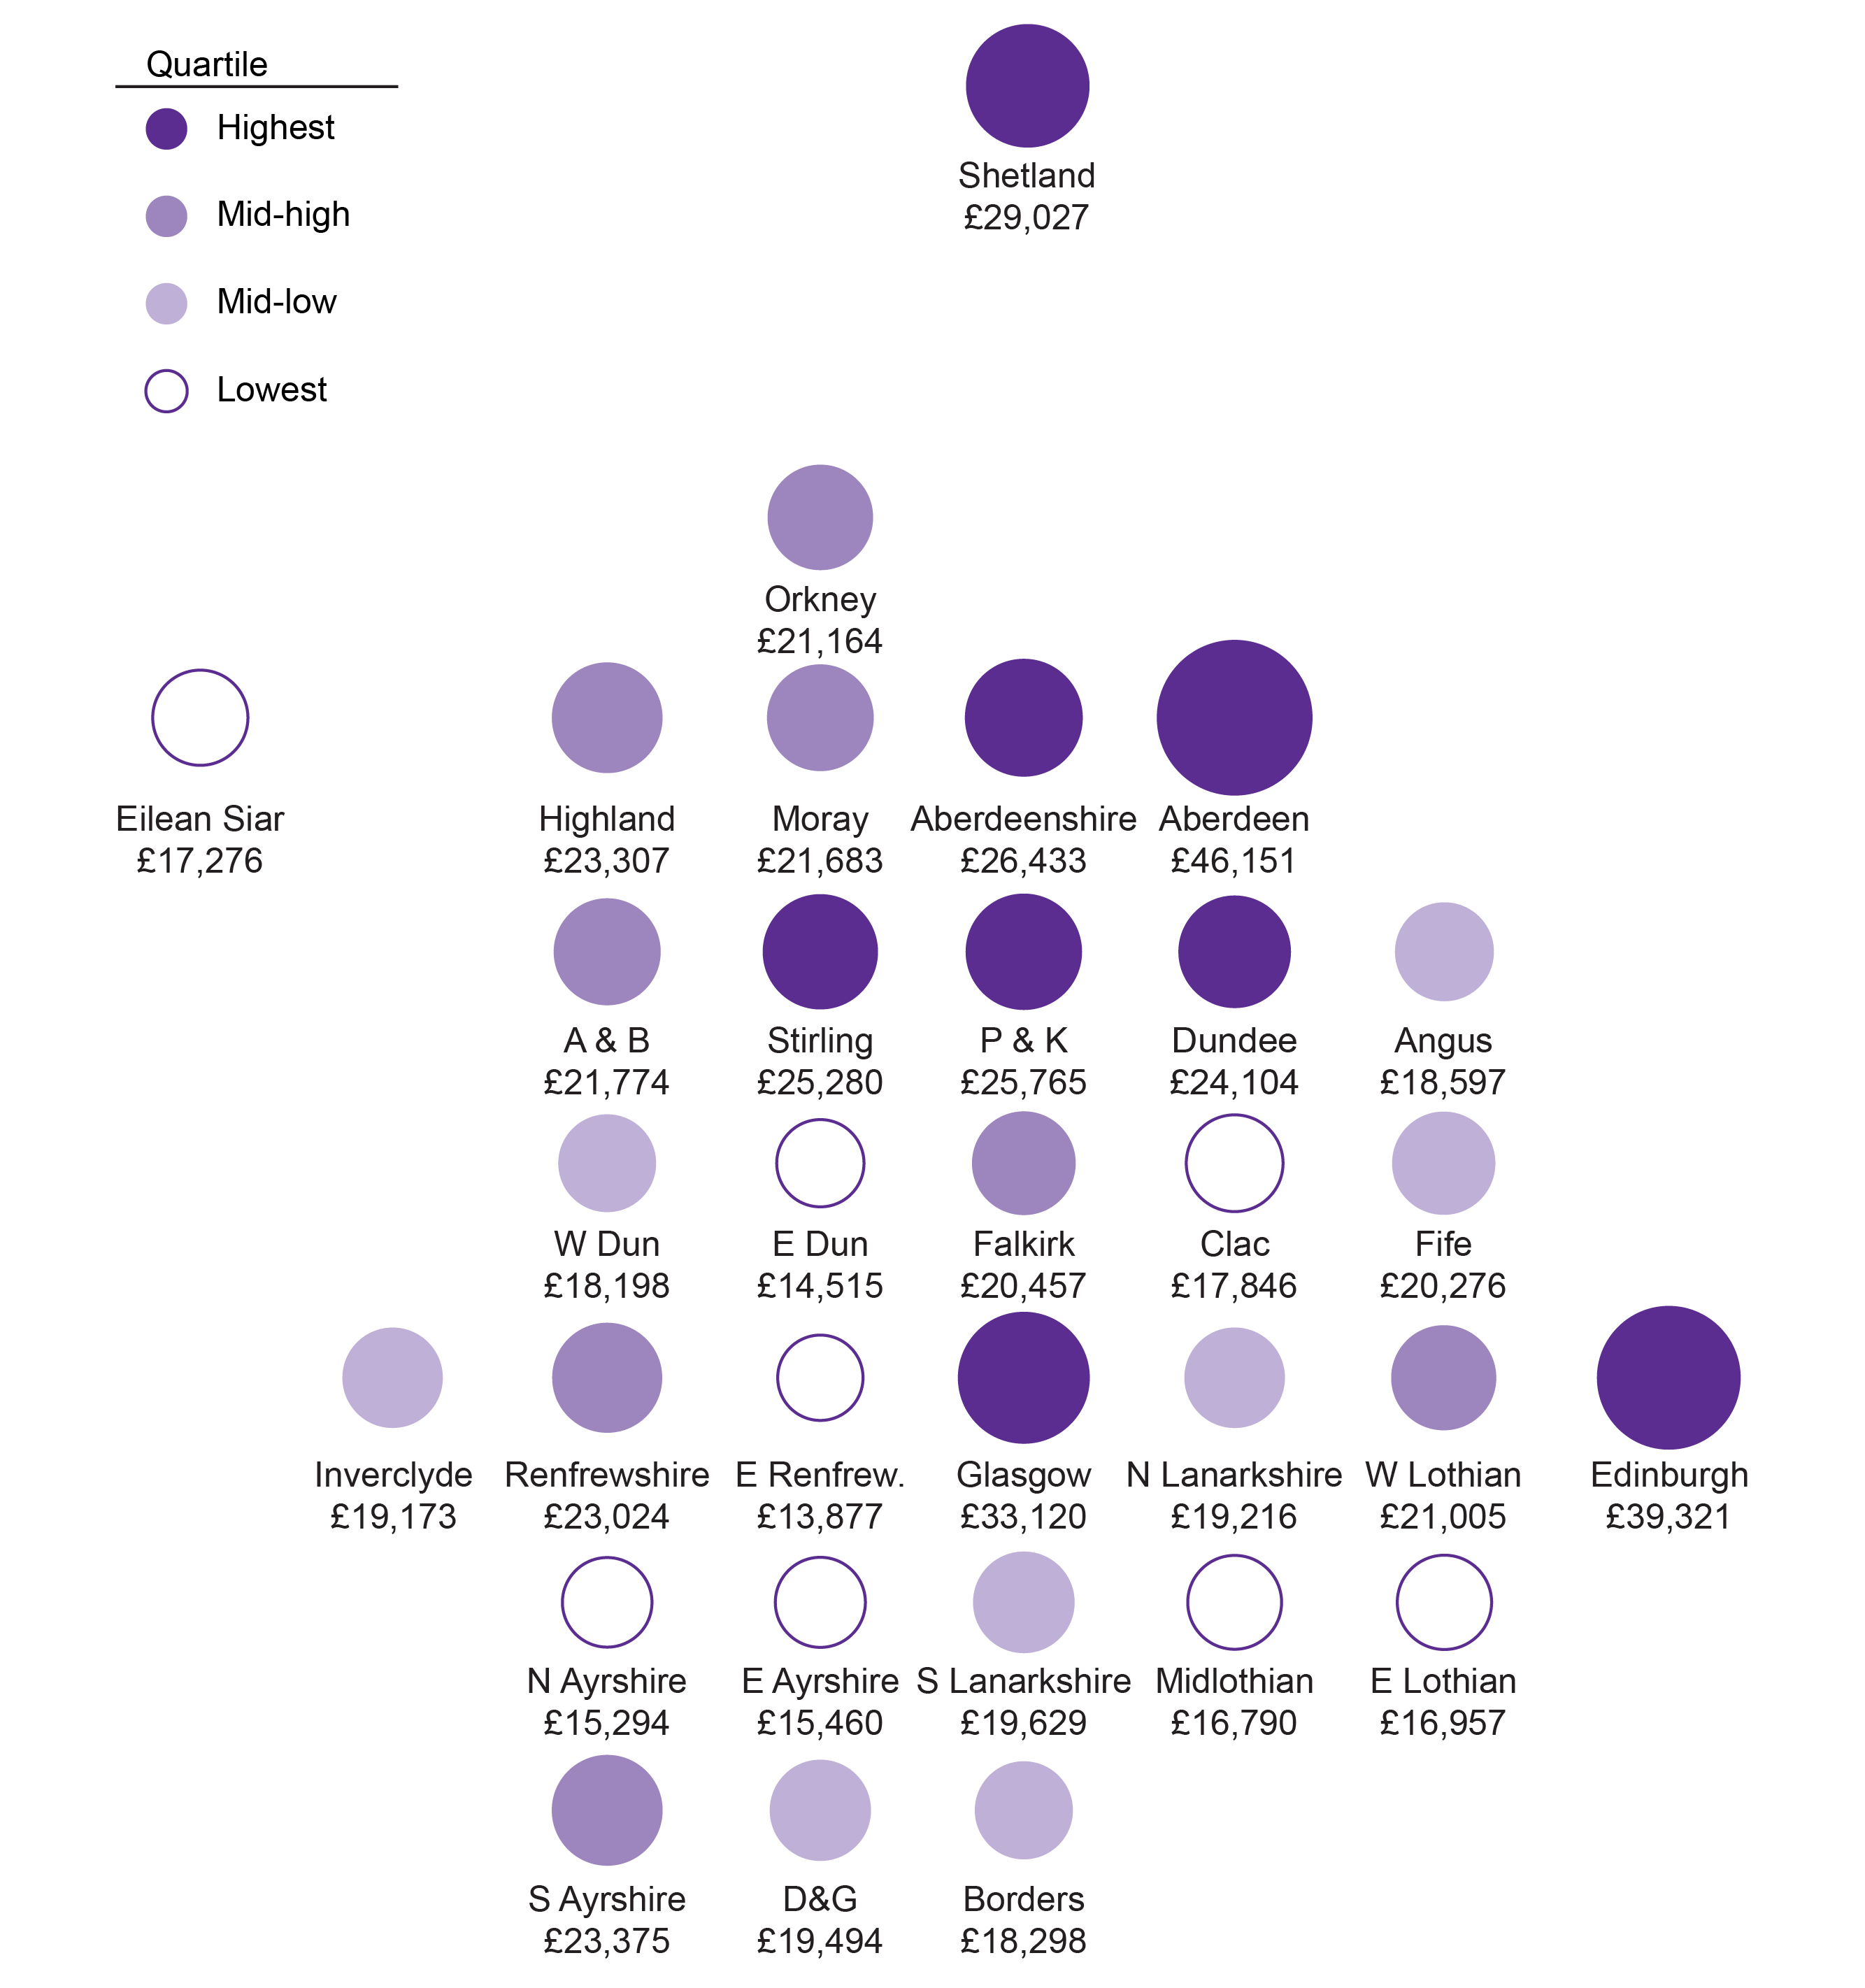
Image: Figure 14: GVA per head by local authority, 2016
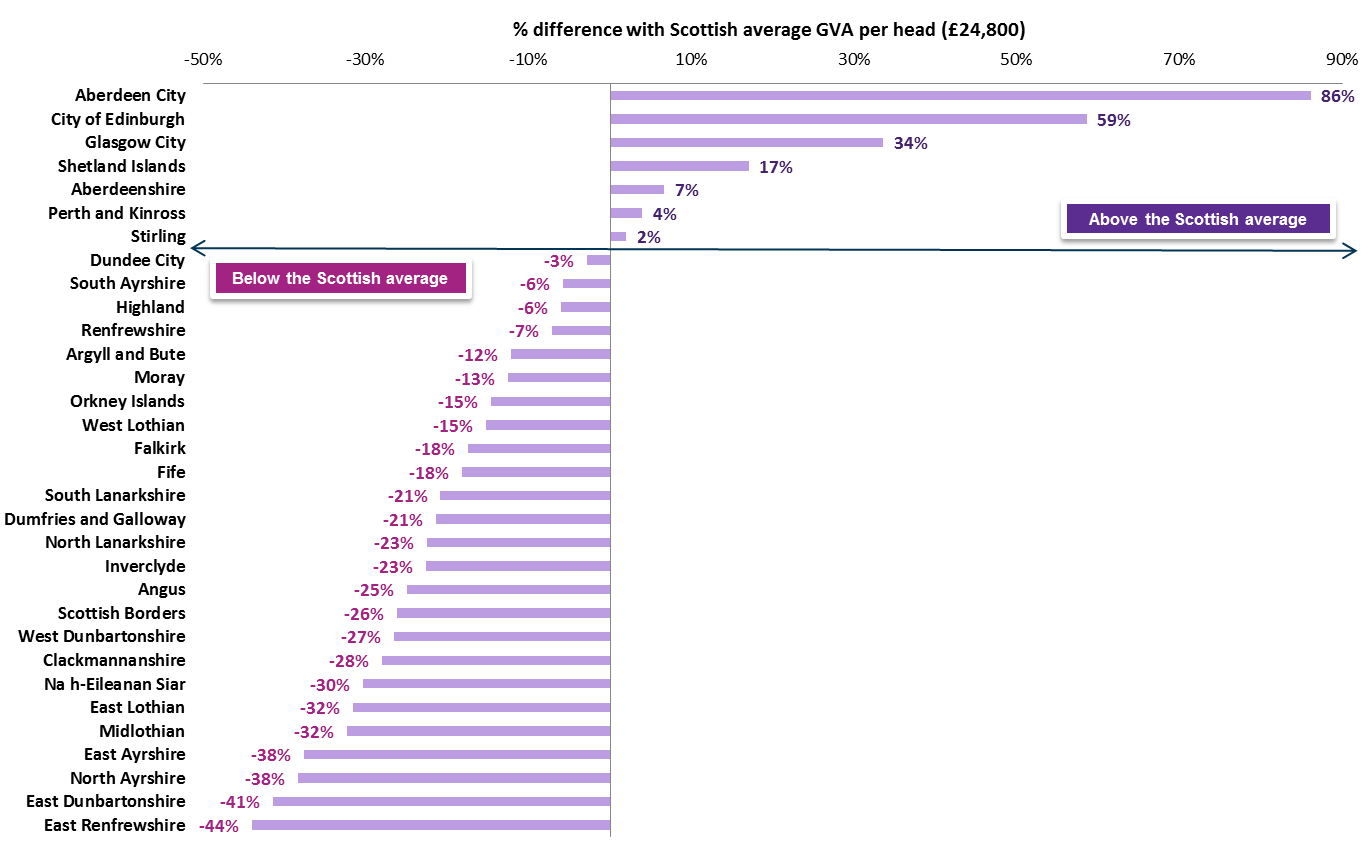
Image: Figure 15: Local authority GVA per head relative to Scottish average, 2016
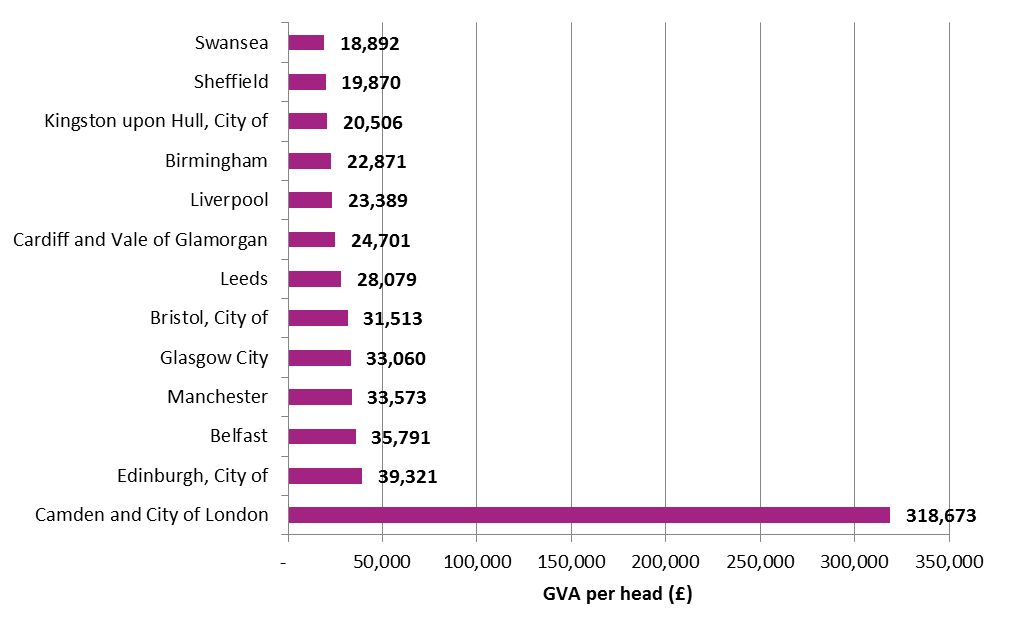
Image: Figure 16: GVA per head - UK city examples, 2016
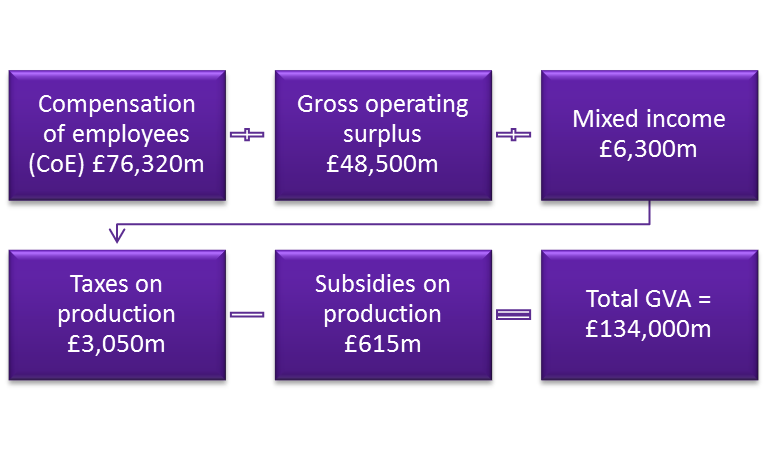
Image: Figure 17: Components of GVA income approach, Scotland, 2016
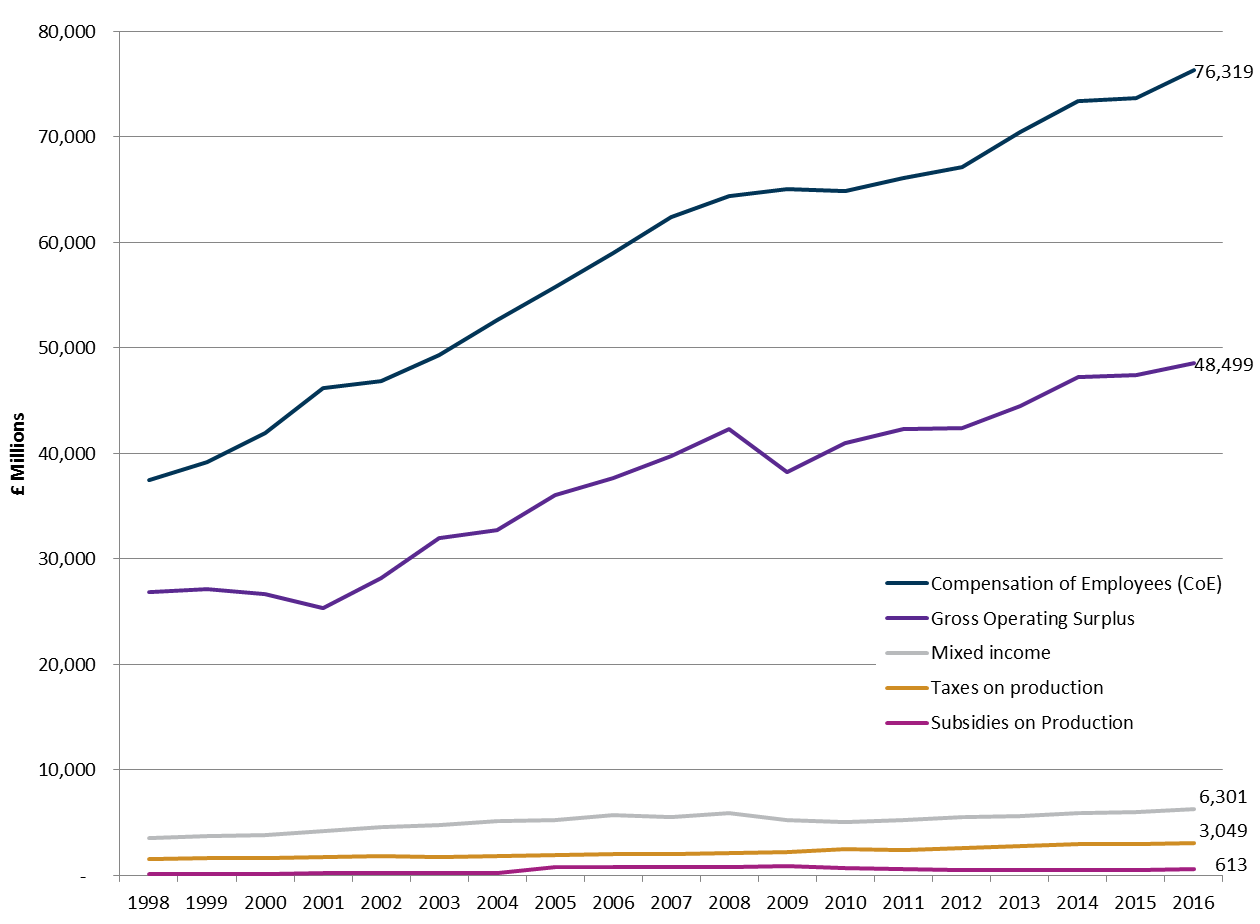
Image: Figure 18: Components of GVA income approach (current prices), Scotland, 1998-2016
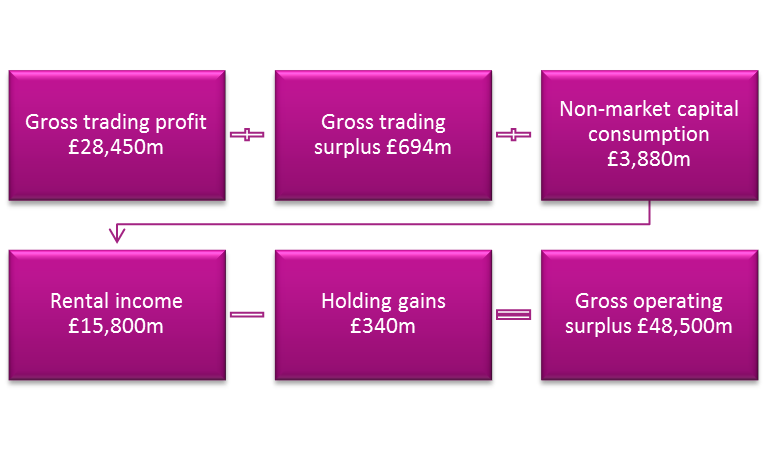
Image: Figure 19: Gross operating surplus components, Scotland, 2016
prev
next
Office for National Statistics. (2010, December). Measuring the economic impact of an intervention or investment. Retrieved from
https://www.ons.gov.uk/ons/rel/regional-analysis/measuring-the-economic-impact-of-an-intervention-or-investment/measuring-the-economic-impact-of-an-intervention-or-investment/economic-impact--paper-one.pdf
[accessed 10 January 2018]
Athow, J. (2018, January 25). GDP: a worthwhile, but incomplete, measure. Retrieved from
https://blog.ons.gov.uk/2018/01/25/gdp-a-worthwhile-but-incomplete-measure/
[accessed 26 January 2018]
The Economist. (2016, April 30). The Trouble with GDP. Retrieved from
https://www.economist.com/news/briefing/21697845-gross-domestic-product-gdp-increasingly-poor-measure-prosperity-it-not-even
[accessed 26 January 2018]
Scottish Government. (2015, March 3). Scotland’s Economic Strategy. Retrieved from
https://beta.gov.scot/publications/scotlands-economic-strategy/
[accessed 5 February 2018]
Scottish Government. (2007). Scotland Performs. Retrieved from
http://www.gov.scot/About/Performance/scotPerforms
[accessed 20 October 2017]
Scottish Government. (2011). Government Economic Strategy. Retrieved from
http://www.gov.scot/Publications/2011/09/13091128/0
[accessed 10 November 2017]
Scottish Government. (2007, November). Government Economic Strategy 2007. Retrieved from
http://www.gov.scot/Publications/2007/11/12115041/0
[accessed 8 February 2018]
SPICe. (2015, September 2). Scotland's Economic Strtegy Briefing. Retrieved from
http://www.parliament.scot/ResearchBriefingsAndFactsheets/S4/SB_15-52_Scotlands_Economic_Strategy.pdf
[accessed 12 February 2018]
Scottish Govenment. (2007). National Performance Framework (NPF). Retrieved from
http://www.gov.scot/About/Performance/scotPerforms/NPFChanges
[accessed 25 October 2017]
Fraser of Allander Institute. (2018, January 25). UK regional performance – an increasingly unbalanced picture?. Retrieved from
https://fraserofallander.org/2018/01/25/uk-regional-performance-an-increasingly-unbalanced-picture/
[accessed 26 January 2018]
Office for National Statistics. (2017, December 20). Regional gross value added (balanced), UK: 1998 to 2016. Retrieved from
https://www.ons.gov.uk/economy/grossvalueaddedgva/bulletins/regionalgrossvalueaddedbalanceduk/1998to2016
[accessed 2018 January 8]
Fraser of Allander. (2018, February 20). Data on Scotland’s economic growth- what’s the difference?. Retrieved from
https://fraserofallander.org/2018/02/20/data-on-scotlands-economic-growth-whats-the-difference/
[accessed 20 February 2018]
Office for National Statistics. (2016, March 23). Changes to National Accounts: Imputed Rental. Retrieved from
https://www.ons.gov.uk/economy/nationalaccounts/uksectoraccounts/articles/changestonationalaccounts/imputedrental
[accessed 20 February 2018]
Scottish Government. (2017, August). Scottish Annual Business Statistics (SABS). Retrieved from
http://www.gov.scot/Topics/Statistics/Browse/Business/SABS
[accessed 1 February 2018]
Rhodes, C. (2018, January 2). Manufacturing: statistics and policy. Retrieved from
http://researchbriefings.parliament.uk/ResearchBriefing/Summary/SN01942
[accessed 1 February 2018]
Office for National Statistics. (2014, April 24). A Comparison between ABS and National Accounts Measures of Value Added. Retrieved from
http://webarchive.nationalarchives.gov.uk/20160106210631/http://www.ons.gov.uk/ons/rel/abs/annual-business-survey/a-comparison-between-abs-and-national-accounts-measures-of-value-added/index.html
[accessed 10 January 2018]
Last Updated: 13/7 5:18am
An error occured while loading, please try again in a few minutes.
Refresh
BACK TO TOP