Recent Reports
Aithisgean ùra
Committee Reports
Aithisgean Chomataidh
Research Briefings
Brathan-ullachaidh Rannsachadh
Feedback
Ais-eòlas
Recent Reports
Aithisgean ùra
Committee Reports
Aithisgean Chomataidh
Research Briefings
Brathan-ullachaidh Rannsachadh
Feedback
Ais-eòlas
Published by The Scottish Parliamentary Corporate Body
Disposable Household Income in Scotland 2015
Author: Andrew Aiton
SHARE
PDF
Published: Monday 18 Sep 2017 (SB 17-65)
Expand
Overview
Report
Hide
Hide
Overview
Report
Executive Summary
What is Gross Disposable Household Income?
How does disposable income compare across the UK?
How has disposable household income changed over time across the UK?
What does the difference between the highest and lowest disposable household incomes look like across the UK?
How does disposable income compare across Scotland?
How has disposable household income changed over time across Scotland?
How does primary household income compare across the UK?
How does share of primary income compare to population share across the UK?
How does primary income compare across Scotland?
How has primary income changed over time?
How does secondary income compare across the UK?
How does secondary income compare across Scotland?
Annex
Sources
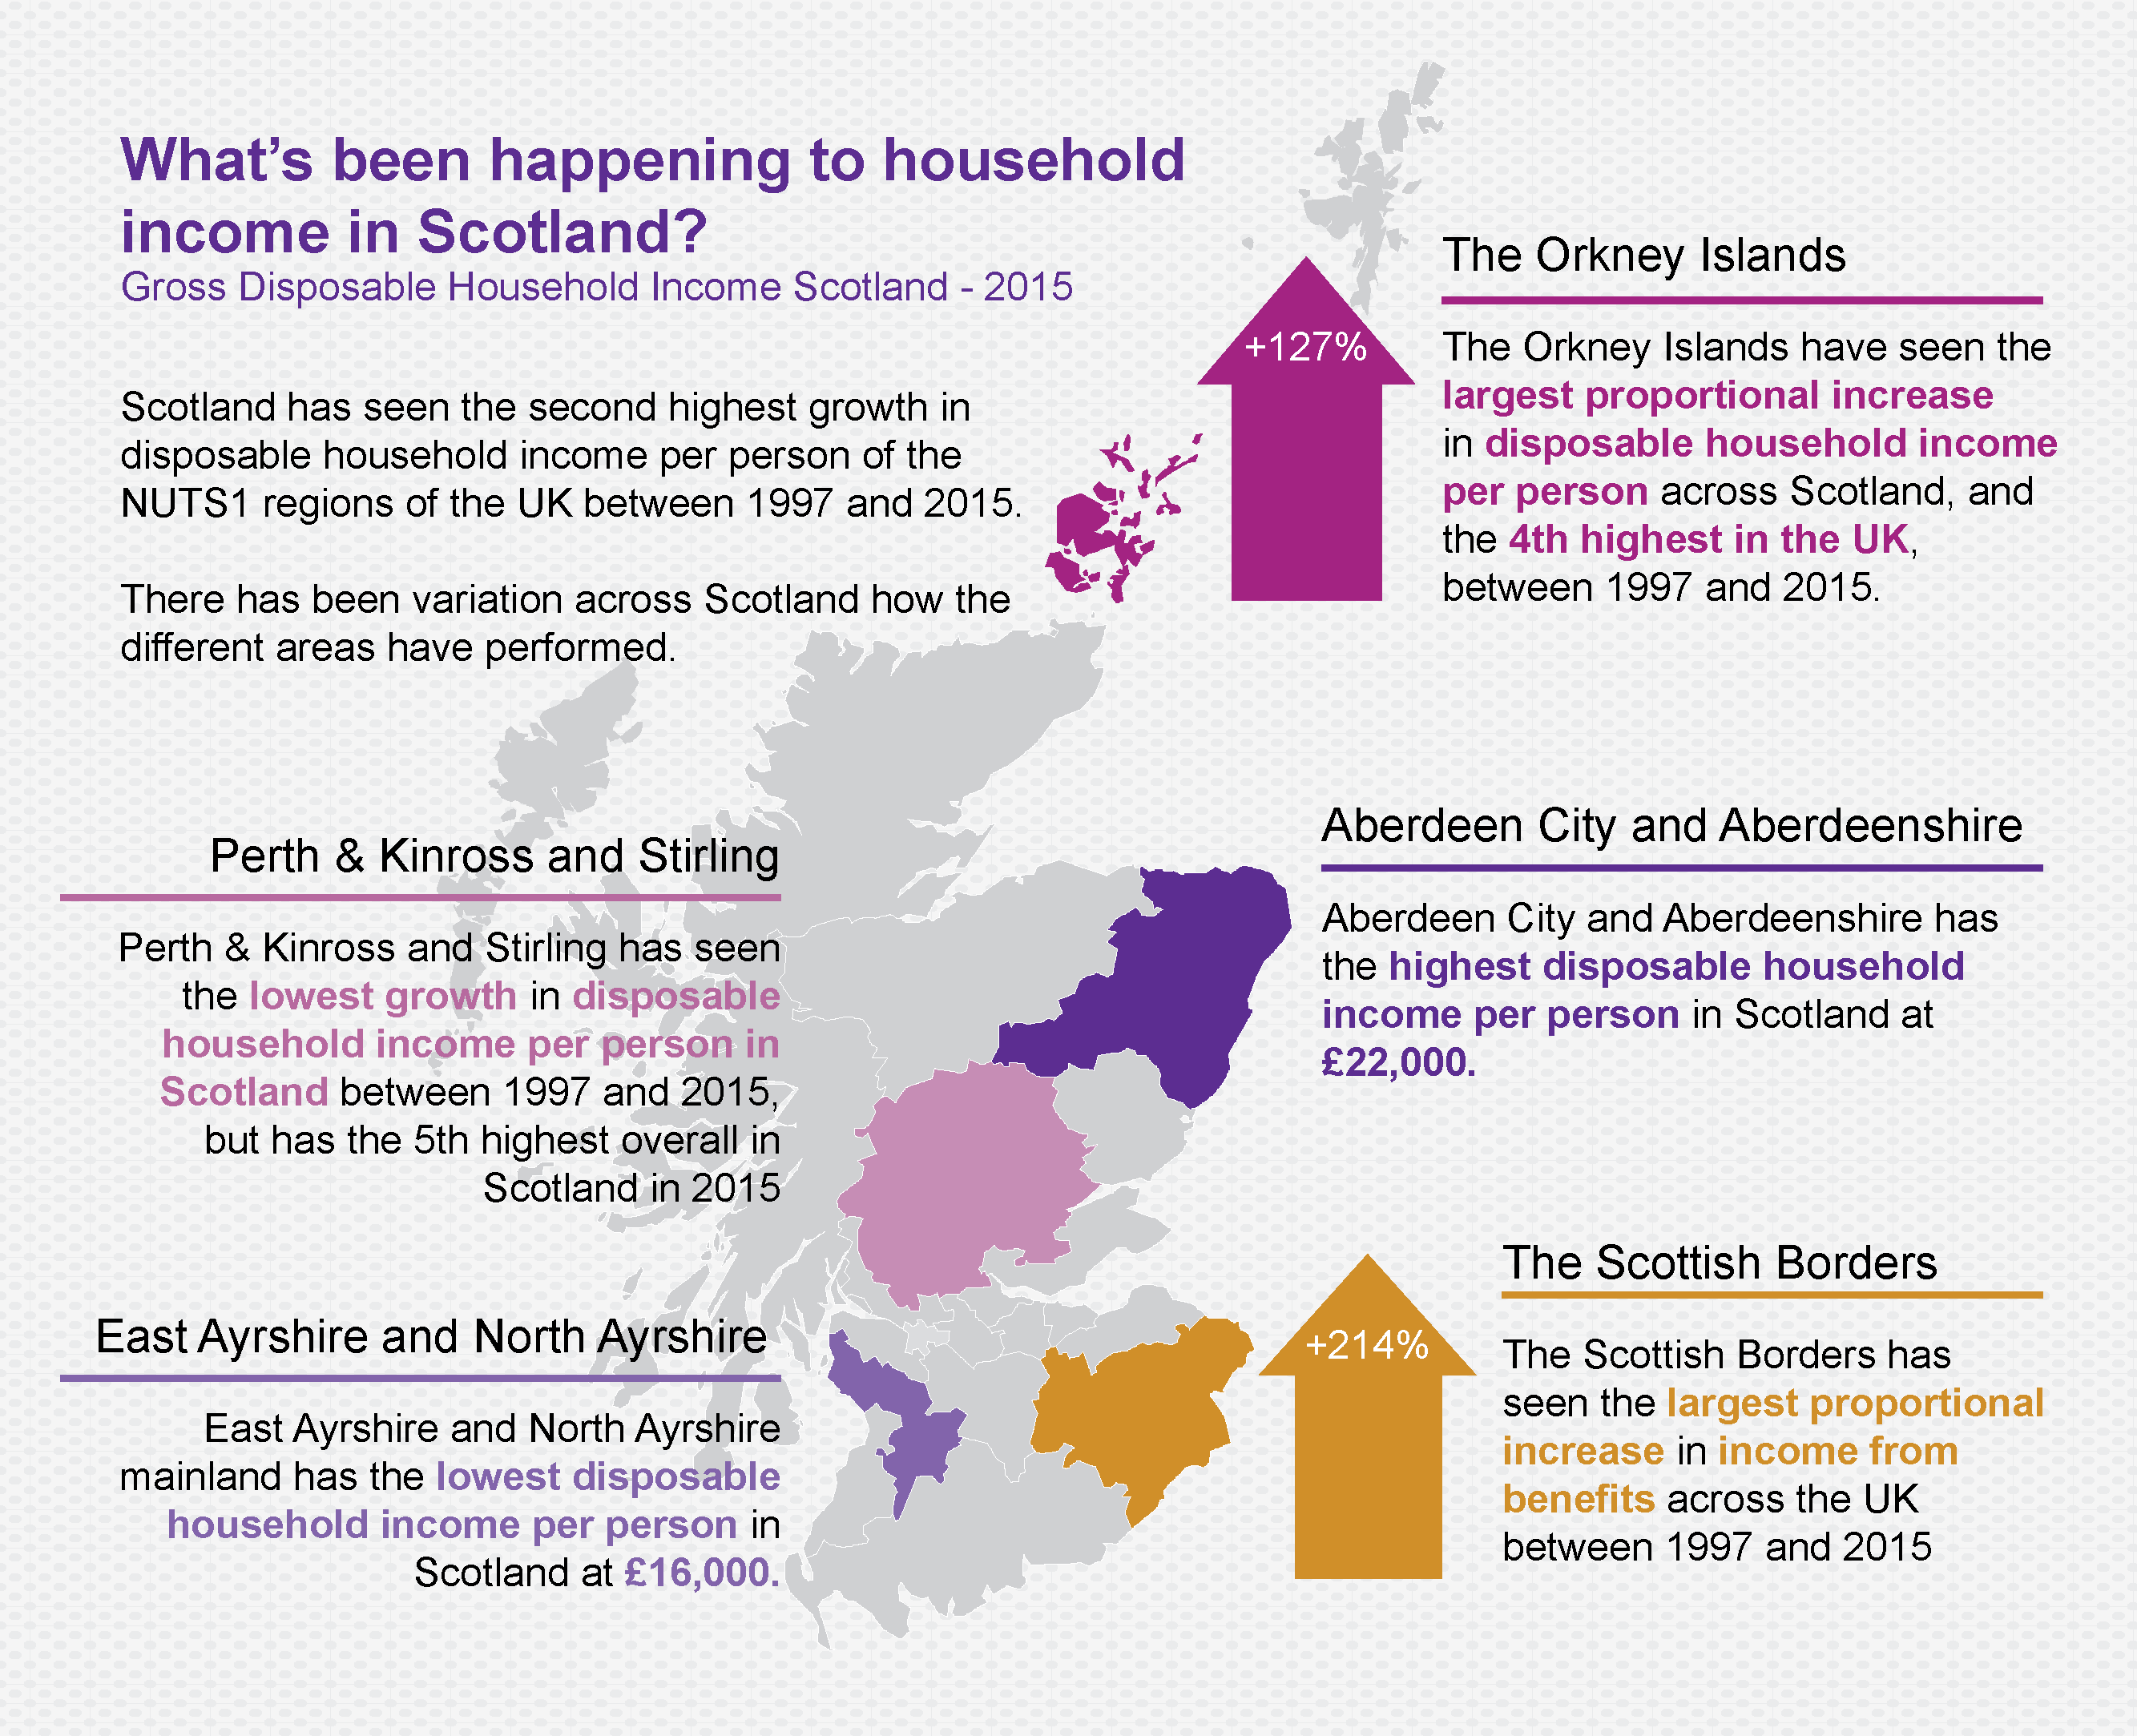
Image: Figure 1: What's been happening to household income in Scotland?
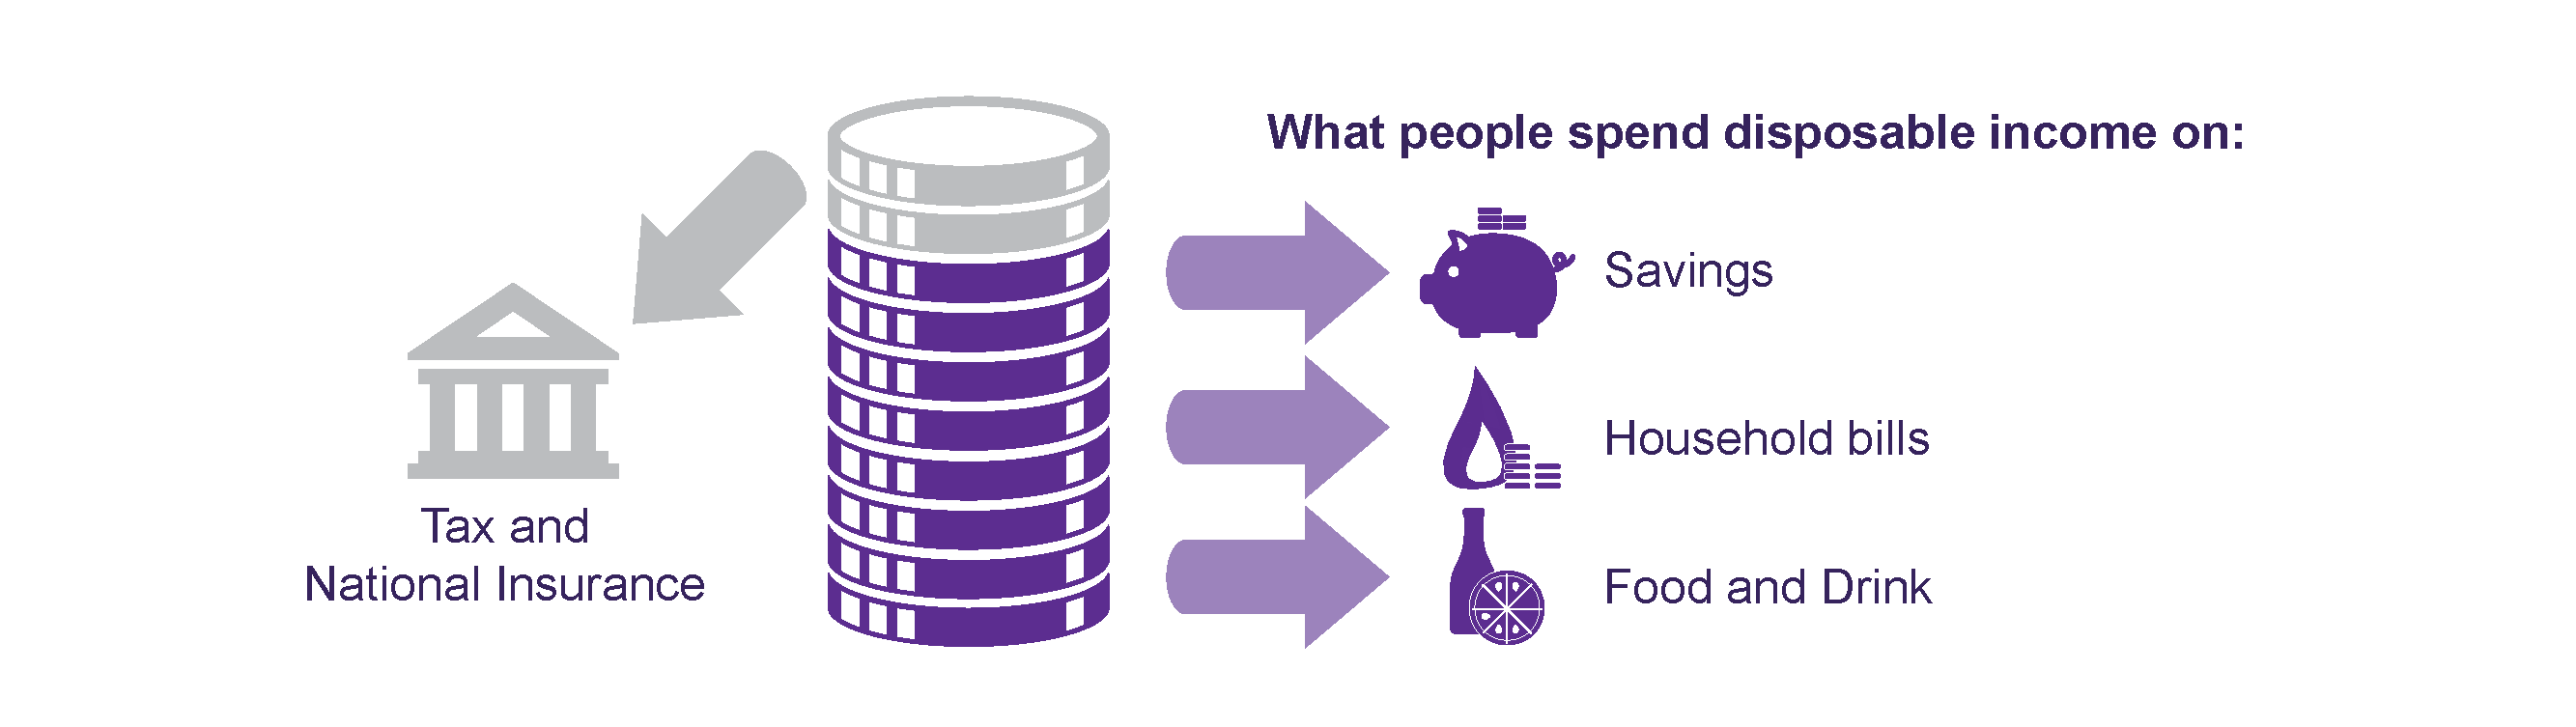
Image: Figure 2: What is disposable income?
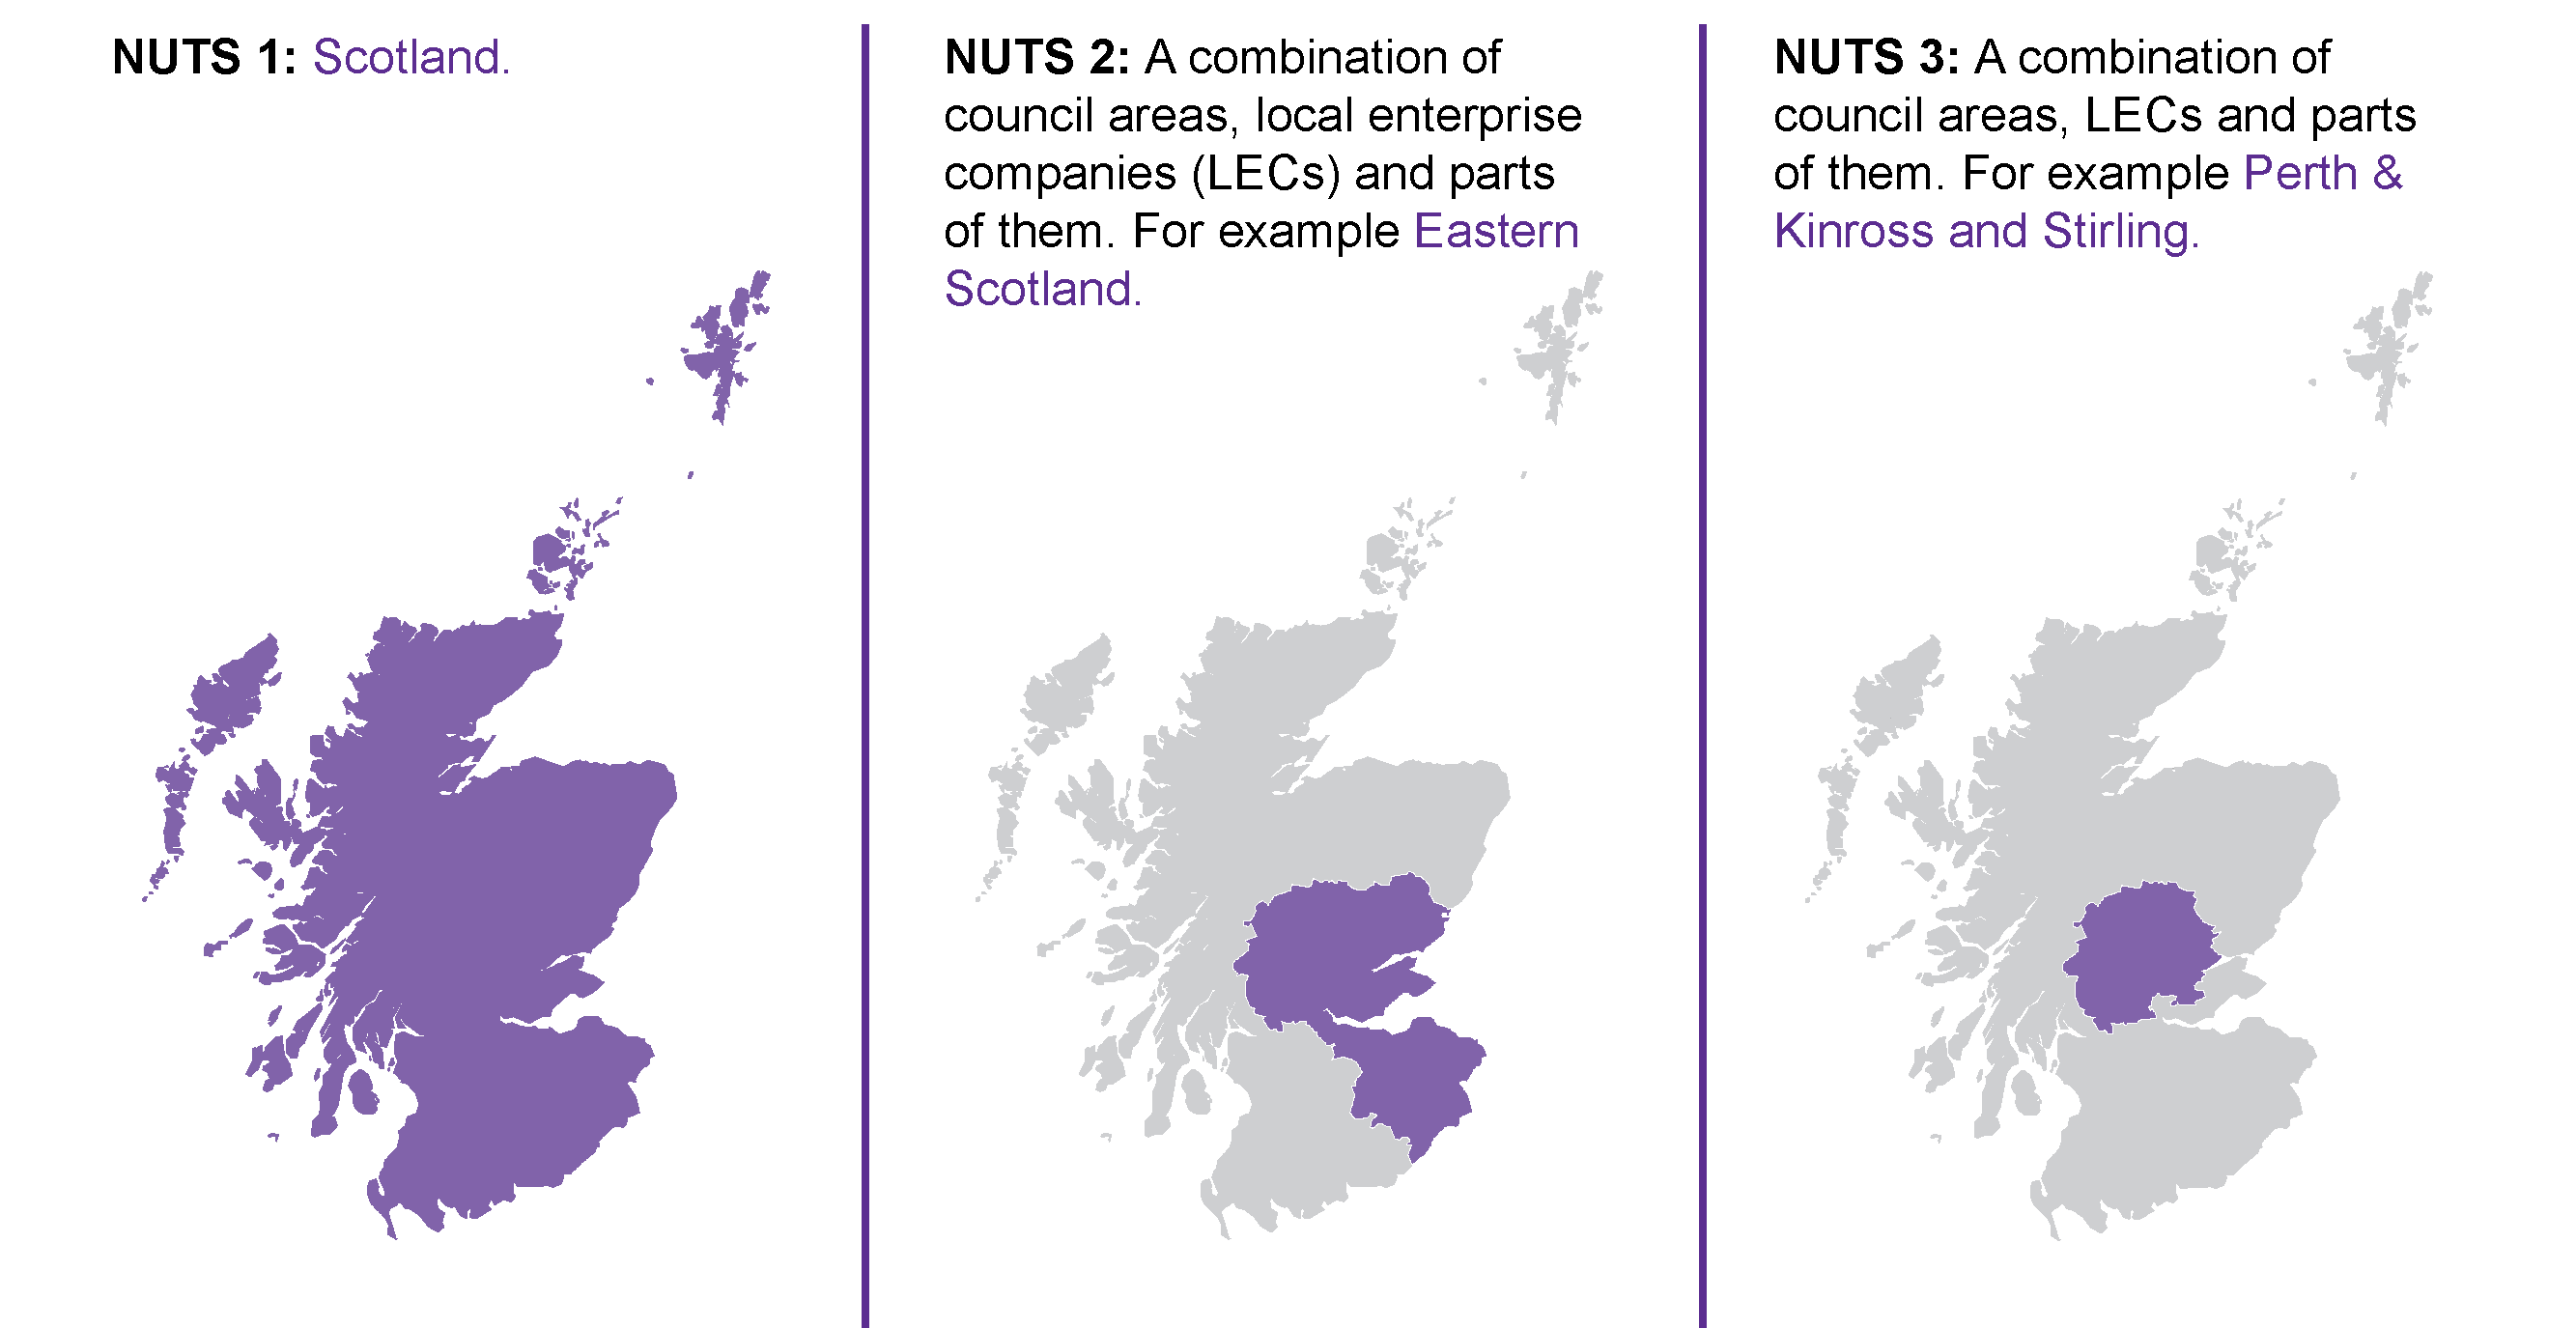
Image: Figure 3: What are Nomenclature of Units for Territorial Statistics (NUTS) regions
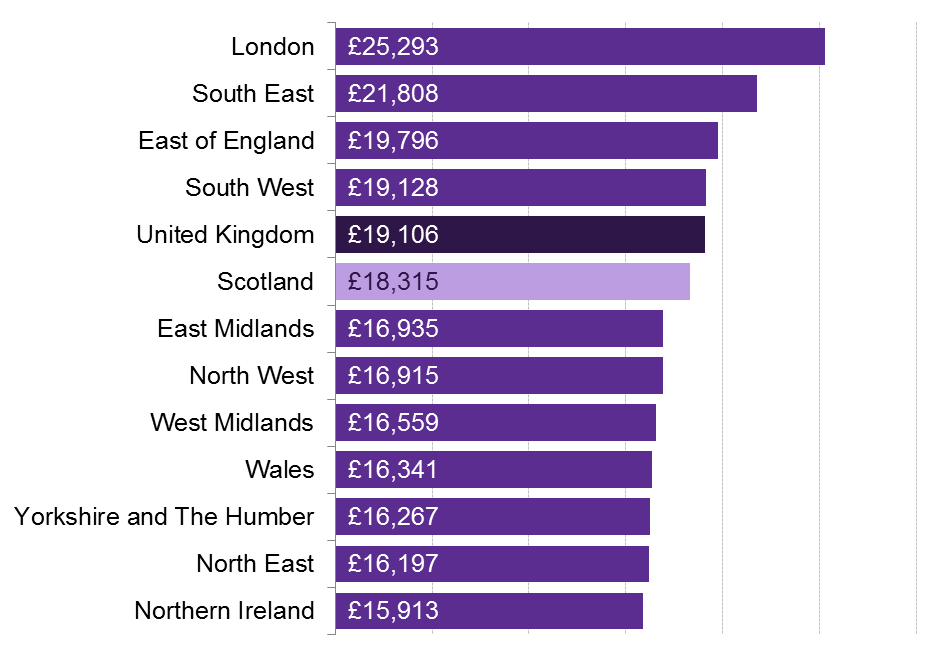
Image: In 2015 Scotland had the fifth highest level of GDHI per person across the UK
Image: Between 1997 and 2015 Scotland has seen the second highest increase in GDHI per person
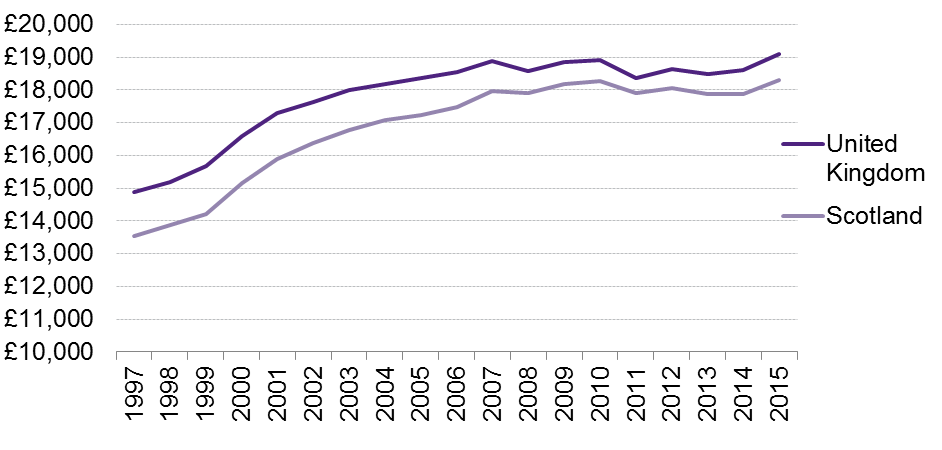
Image: The gap between Scotland and the UK for GDHI person has narrowed between 1997 and 2015
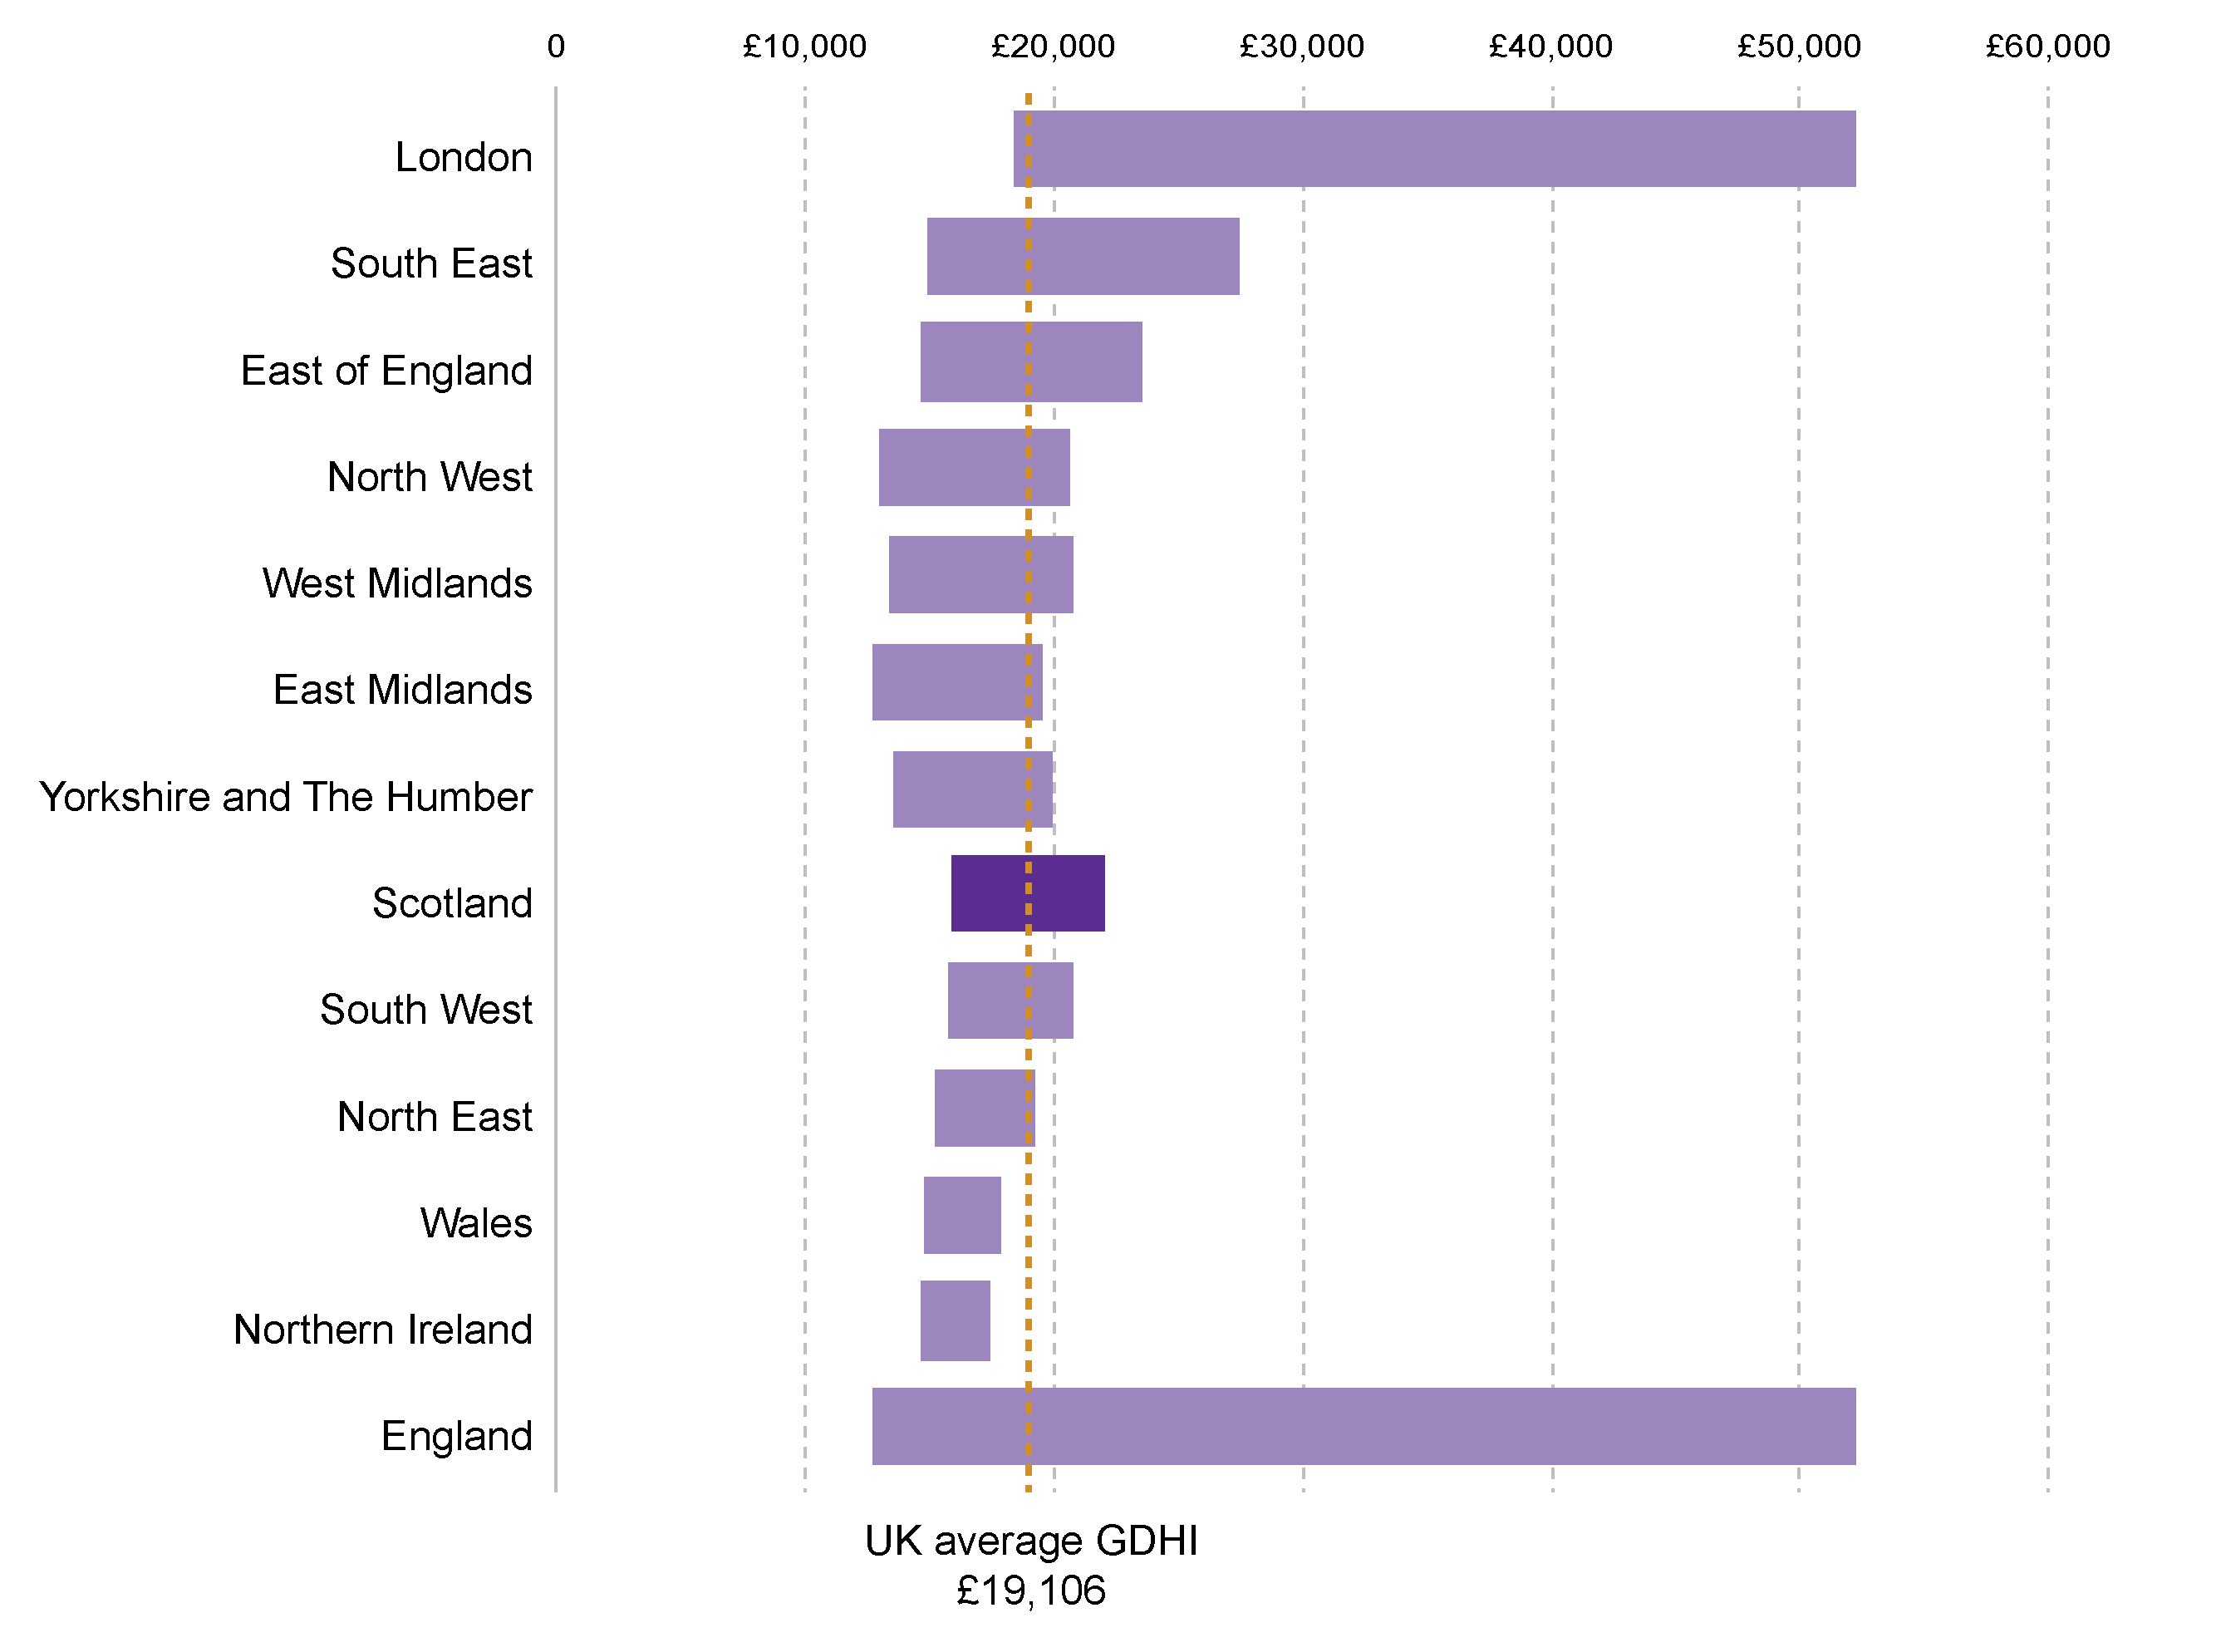
Image: London had the largest difference between the NUT3 areas with the lowest and highest GDHI per person in 2015
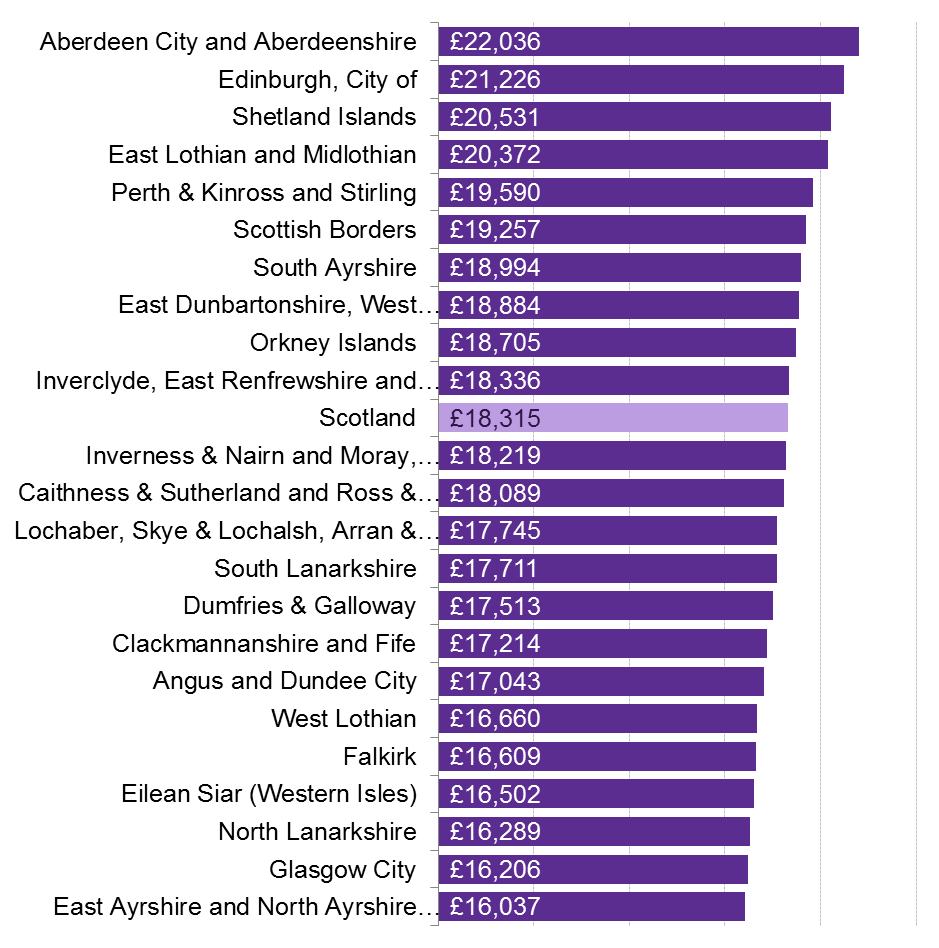
Image: Aberdeen and Aberdeenshire had the highest GDHI per person in Scotland in 2015
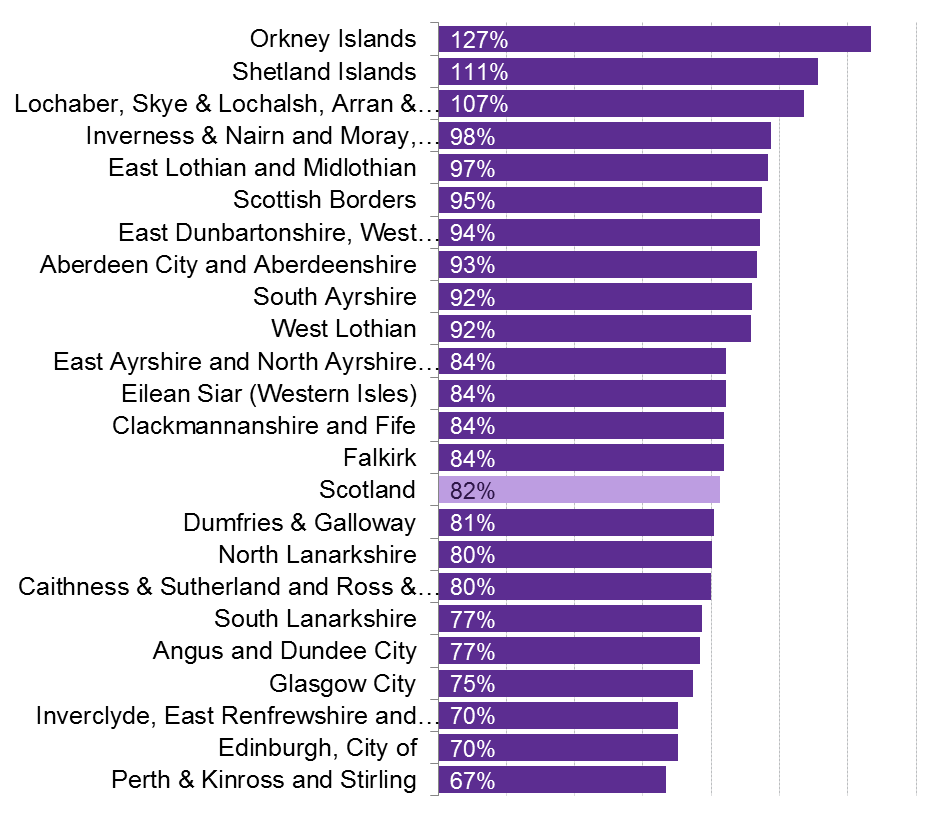
Image: Orkney has seen the largest proportional increase in GDHI per person between 1997 and 2015
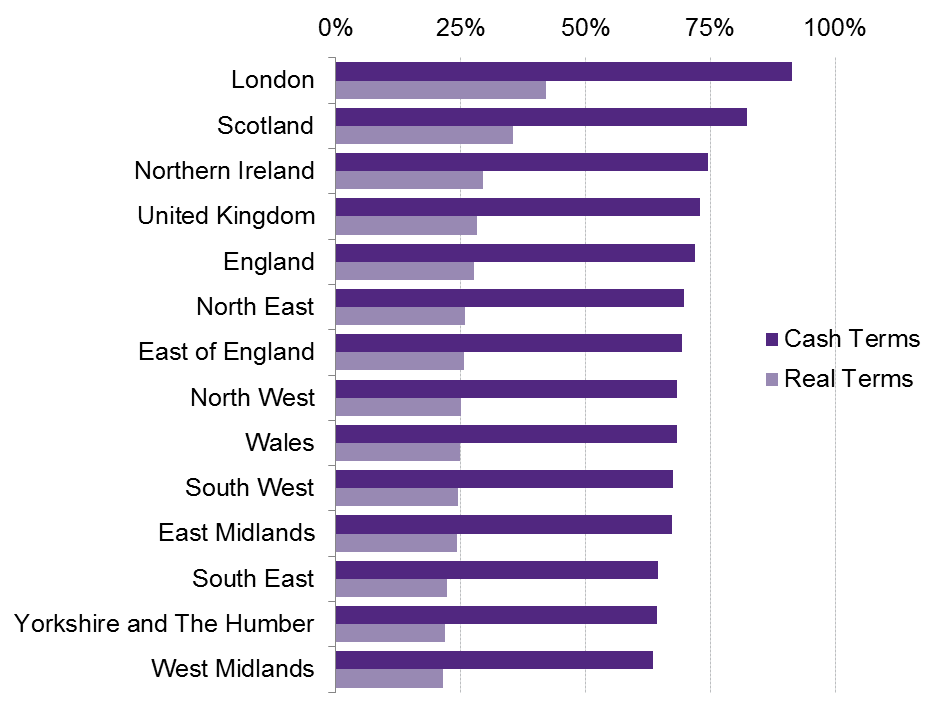
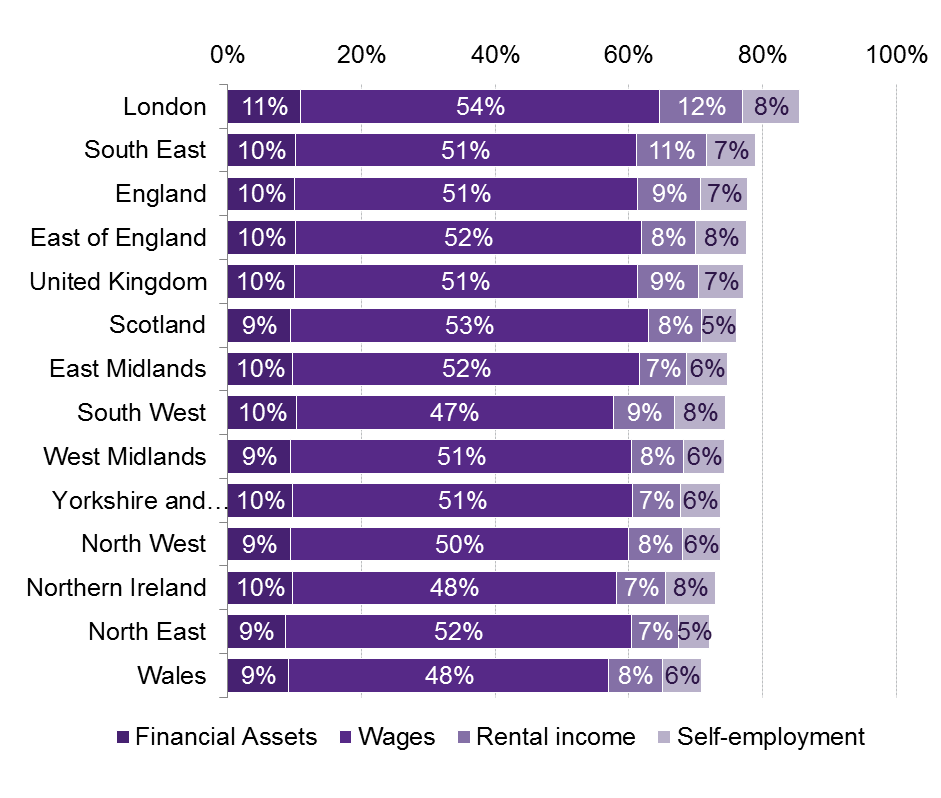
Image: London had the highest proportion of income from primary sources in 2015
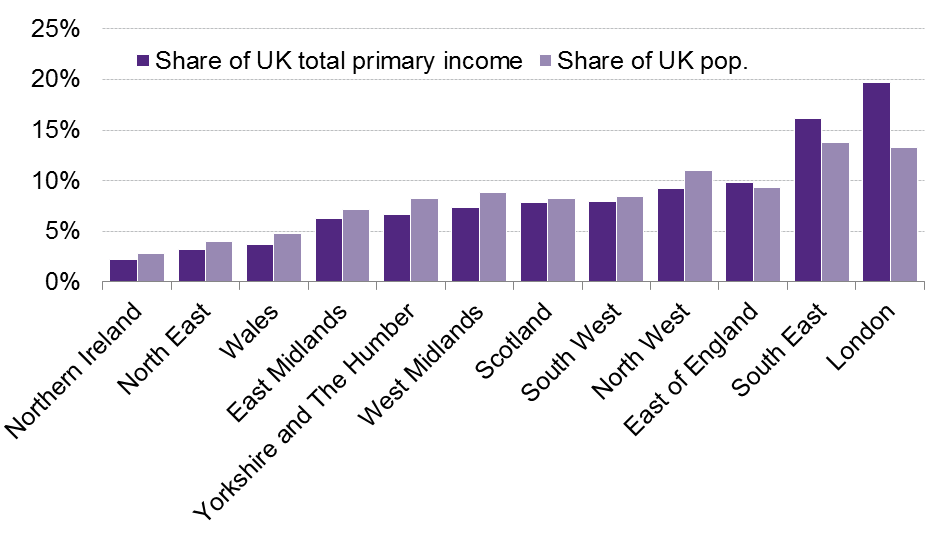
Image: Figure 11: Comparison of share of total primary income and population share - 2015
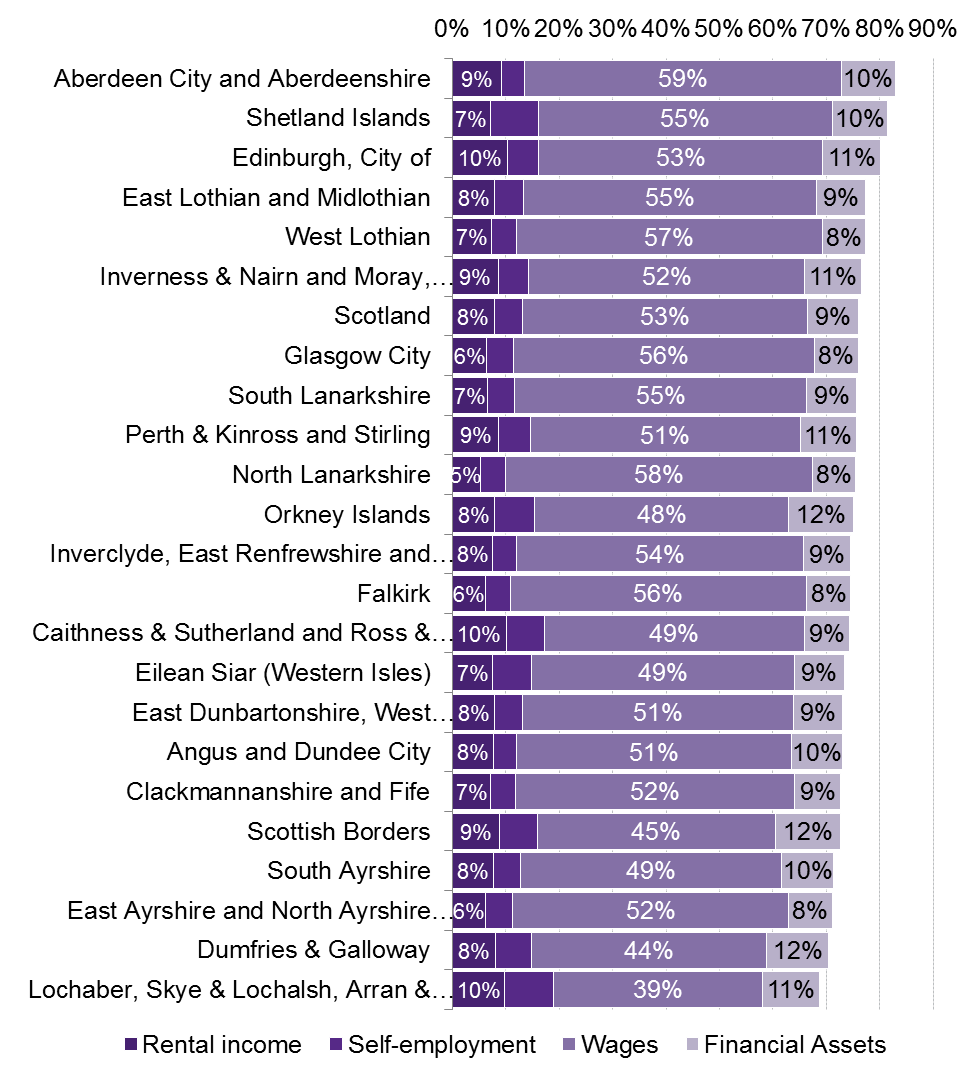
Image: Figure 12: Proportion of primary income by type for the NUTS3 regions of Scotland -2015
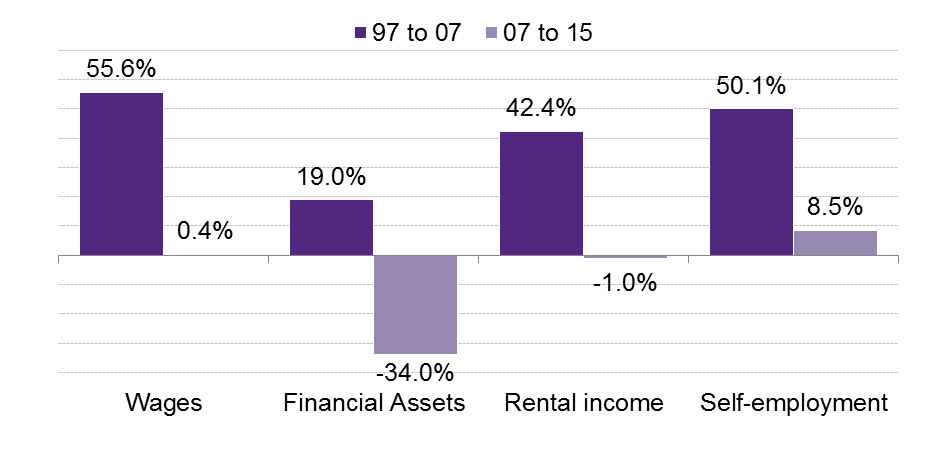
Image: Income from self-employment is the only source of primary income which has significantly increased in real terms between 2007 and 2015
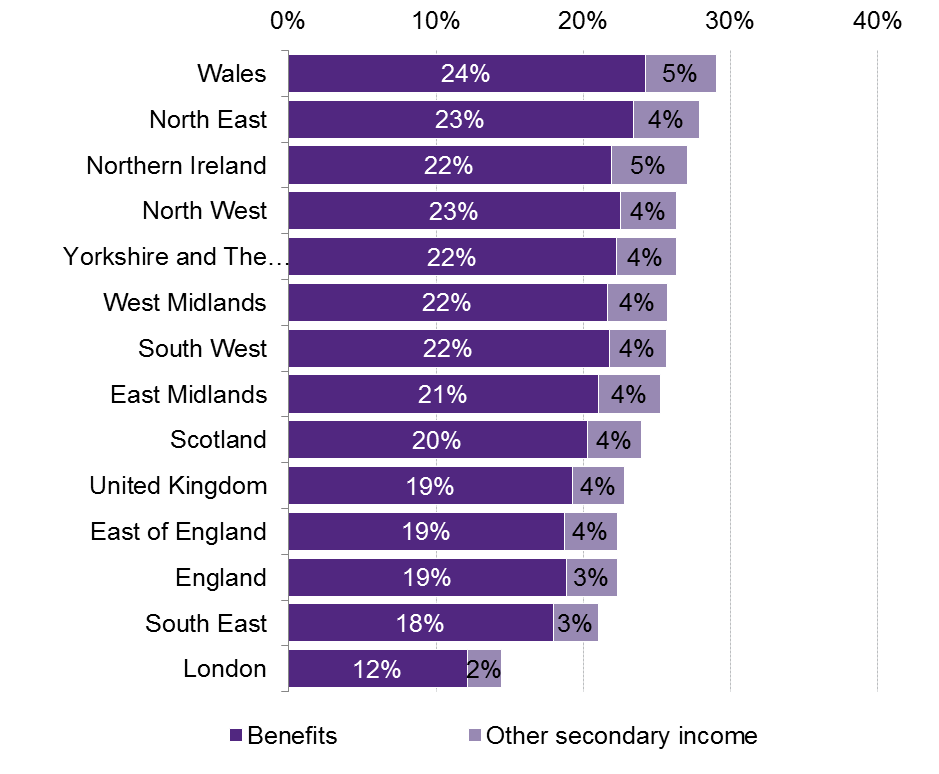
Image: A fifth of household income in Scotland came from benefits in 2015
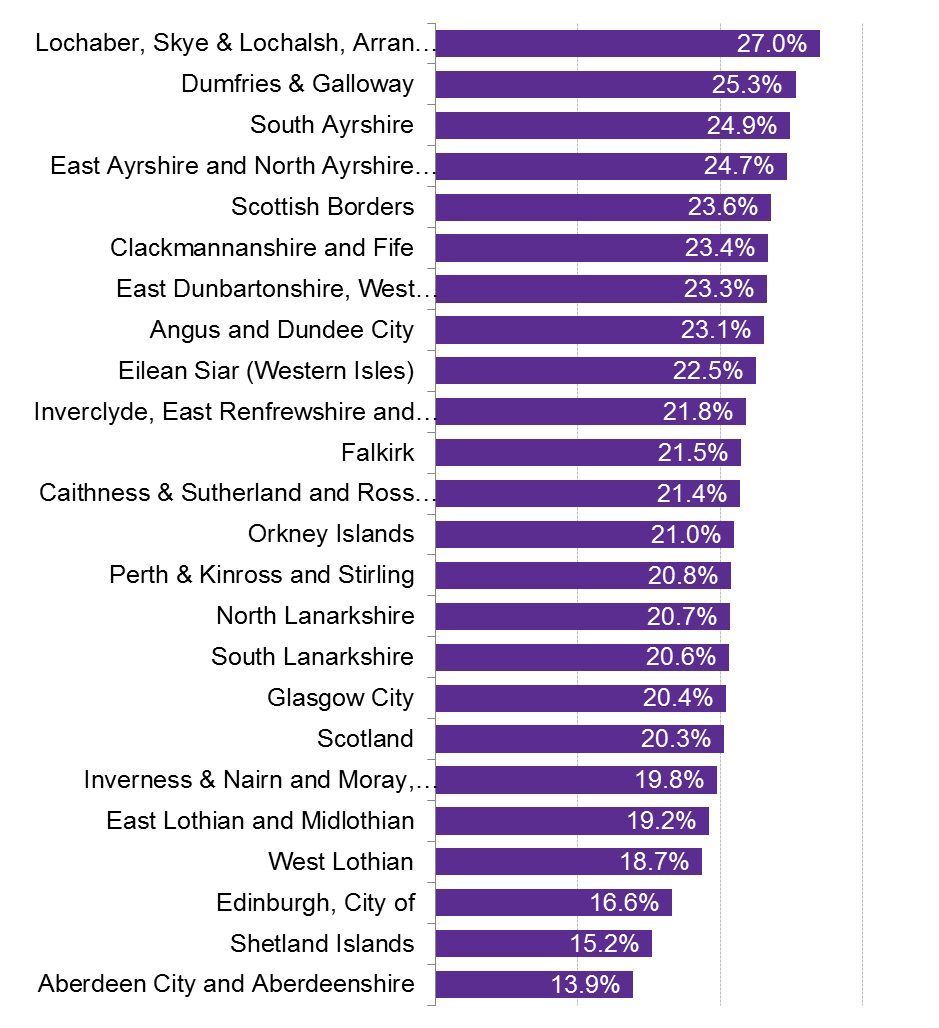
Image: Figure 15: Proportion of total income from benefits for the NUTS3 regions of Scotland -2015
prev
next
Office for National Statistics. (2017, May 24). Regional gross disposable household income (GDHI): 1997 to 2015. Retrieved from
https://www.ons.gov.uk/economy/regionalaccounts/grossdisposablehouseholdincome/bulletins/regionalgrossdisposablehouseholdincomegdhi/2015
[accessed May 2017]
Office for National Statistics. (2017, January). Households and NPISH expenditure: Implied deflator: SA. Retrieved from
https://www.ons.gov.uk/economy/grossdomesticproductgdp/timeseries/ybfs/qna
[accessed July 2017]
Scottish Government. (2016, November 8). Private Sector Rent Statistics, Scotland, 2010 to 2016. Retrieved from
http://www.gov.scot/Publications/2016/11/3295
[accessed 26 July 2017]
Office for National Statistics. (2013). Where do we commute to? Commuting patterns in the United Kingdom, 2011 Census. Retrieved from
http://webarchive.nationalarchives.gov.uk/20151013153922/http://www.neighbourhood.statistics.gov.uk/HTMLDocs/dvc193/index.html#sty=true&flow=flow1&period=0&fix=undefined&view=200,-40,630,635&tr=-193.72886117034767,-92.90627729286877&sc=1.5157165665103982
[accessed 26 July 2017]
Last Updated: 13/7 1:14am
An error occured while loading, please try again in a few minutes.
Refresh
BACK TO TOP