Recent Reports
Aithisgean ùra
Committee Reports
Aithisgean Chomataidh
Research Briefings
Brathan-ullachaidh Rannsachadh
Feedback
Ais-eòlas
Recent Reports
Aithisgean ùra
Committee Reports
Aithisgean Chomataidh
Research Briefings
Brathan-ullachaidh Rannsachadh
Feedback
Ais-eòlas
Published by The Scottish Parliamentary Corporate Body
Labour Market update: October 2017
Author: Andrew Aiton
SHARE
PDF
Published: Thursday 19 Oct 2017 (SB 17-72)
Expand
Overview
Report
Hide
Hide
Overview
Report
Executive Summary
What are the labour market measurements?
Unemployment
Unemployment by Gender
Unemployment by age
Employment
Employment by Gender
Employment by Age
Economic Inactivity
Economic Inactivity by Gender
Economic Inactivity by Age
Claimant Count
Constituency data: Unemployment Rate
Guest Indicator: Inactivity in Scotland
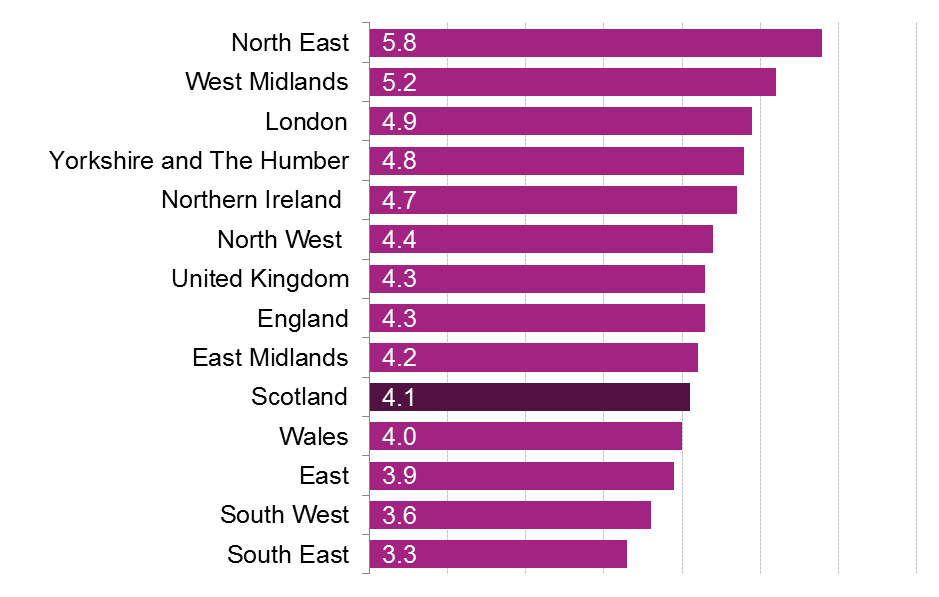
Image: Figure 1: Unemployment rates across the UK (16+)- Jun-Aug 2017
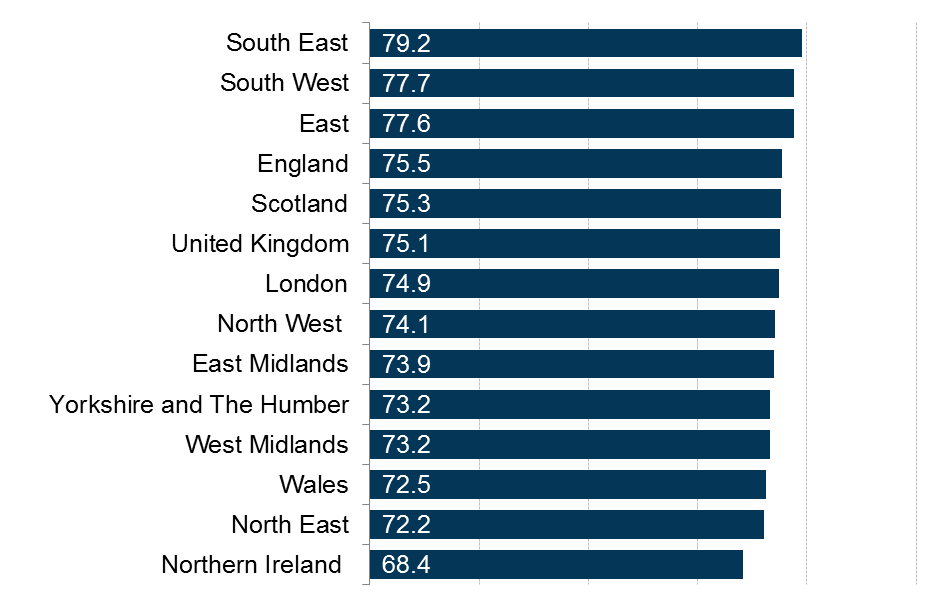
Image: Figure 2: Employment rates across the UK (16-64)- Jun-Aug 2017
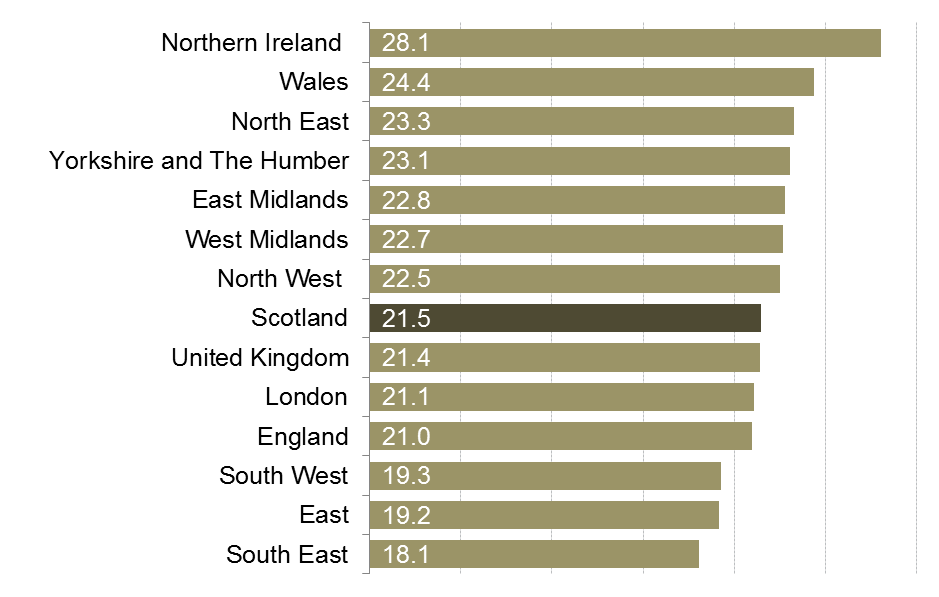
Image: Figure 3: Economic inactivity rates across the UK (16-64)- Jun-Aug 2017
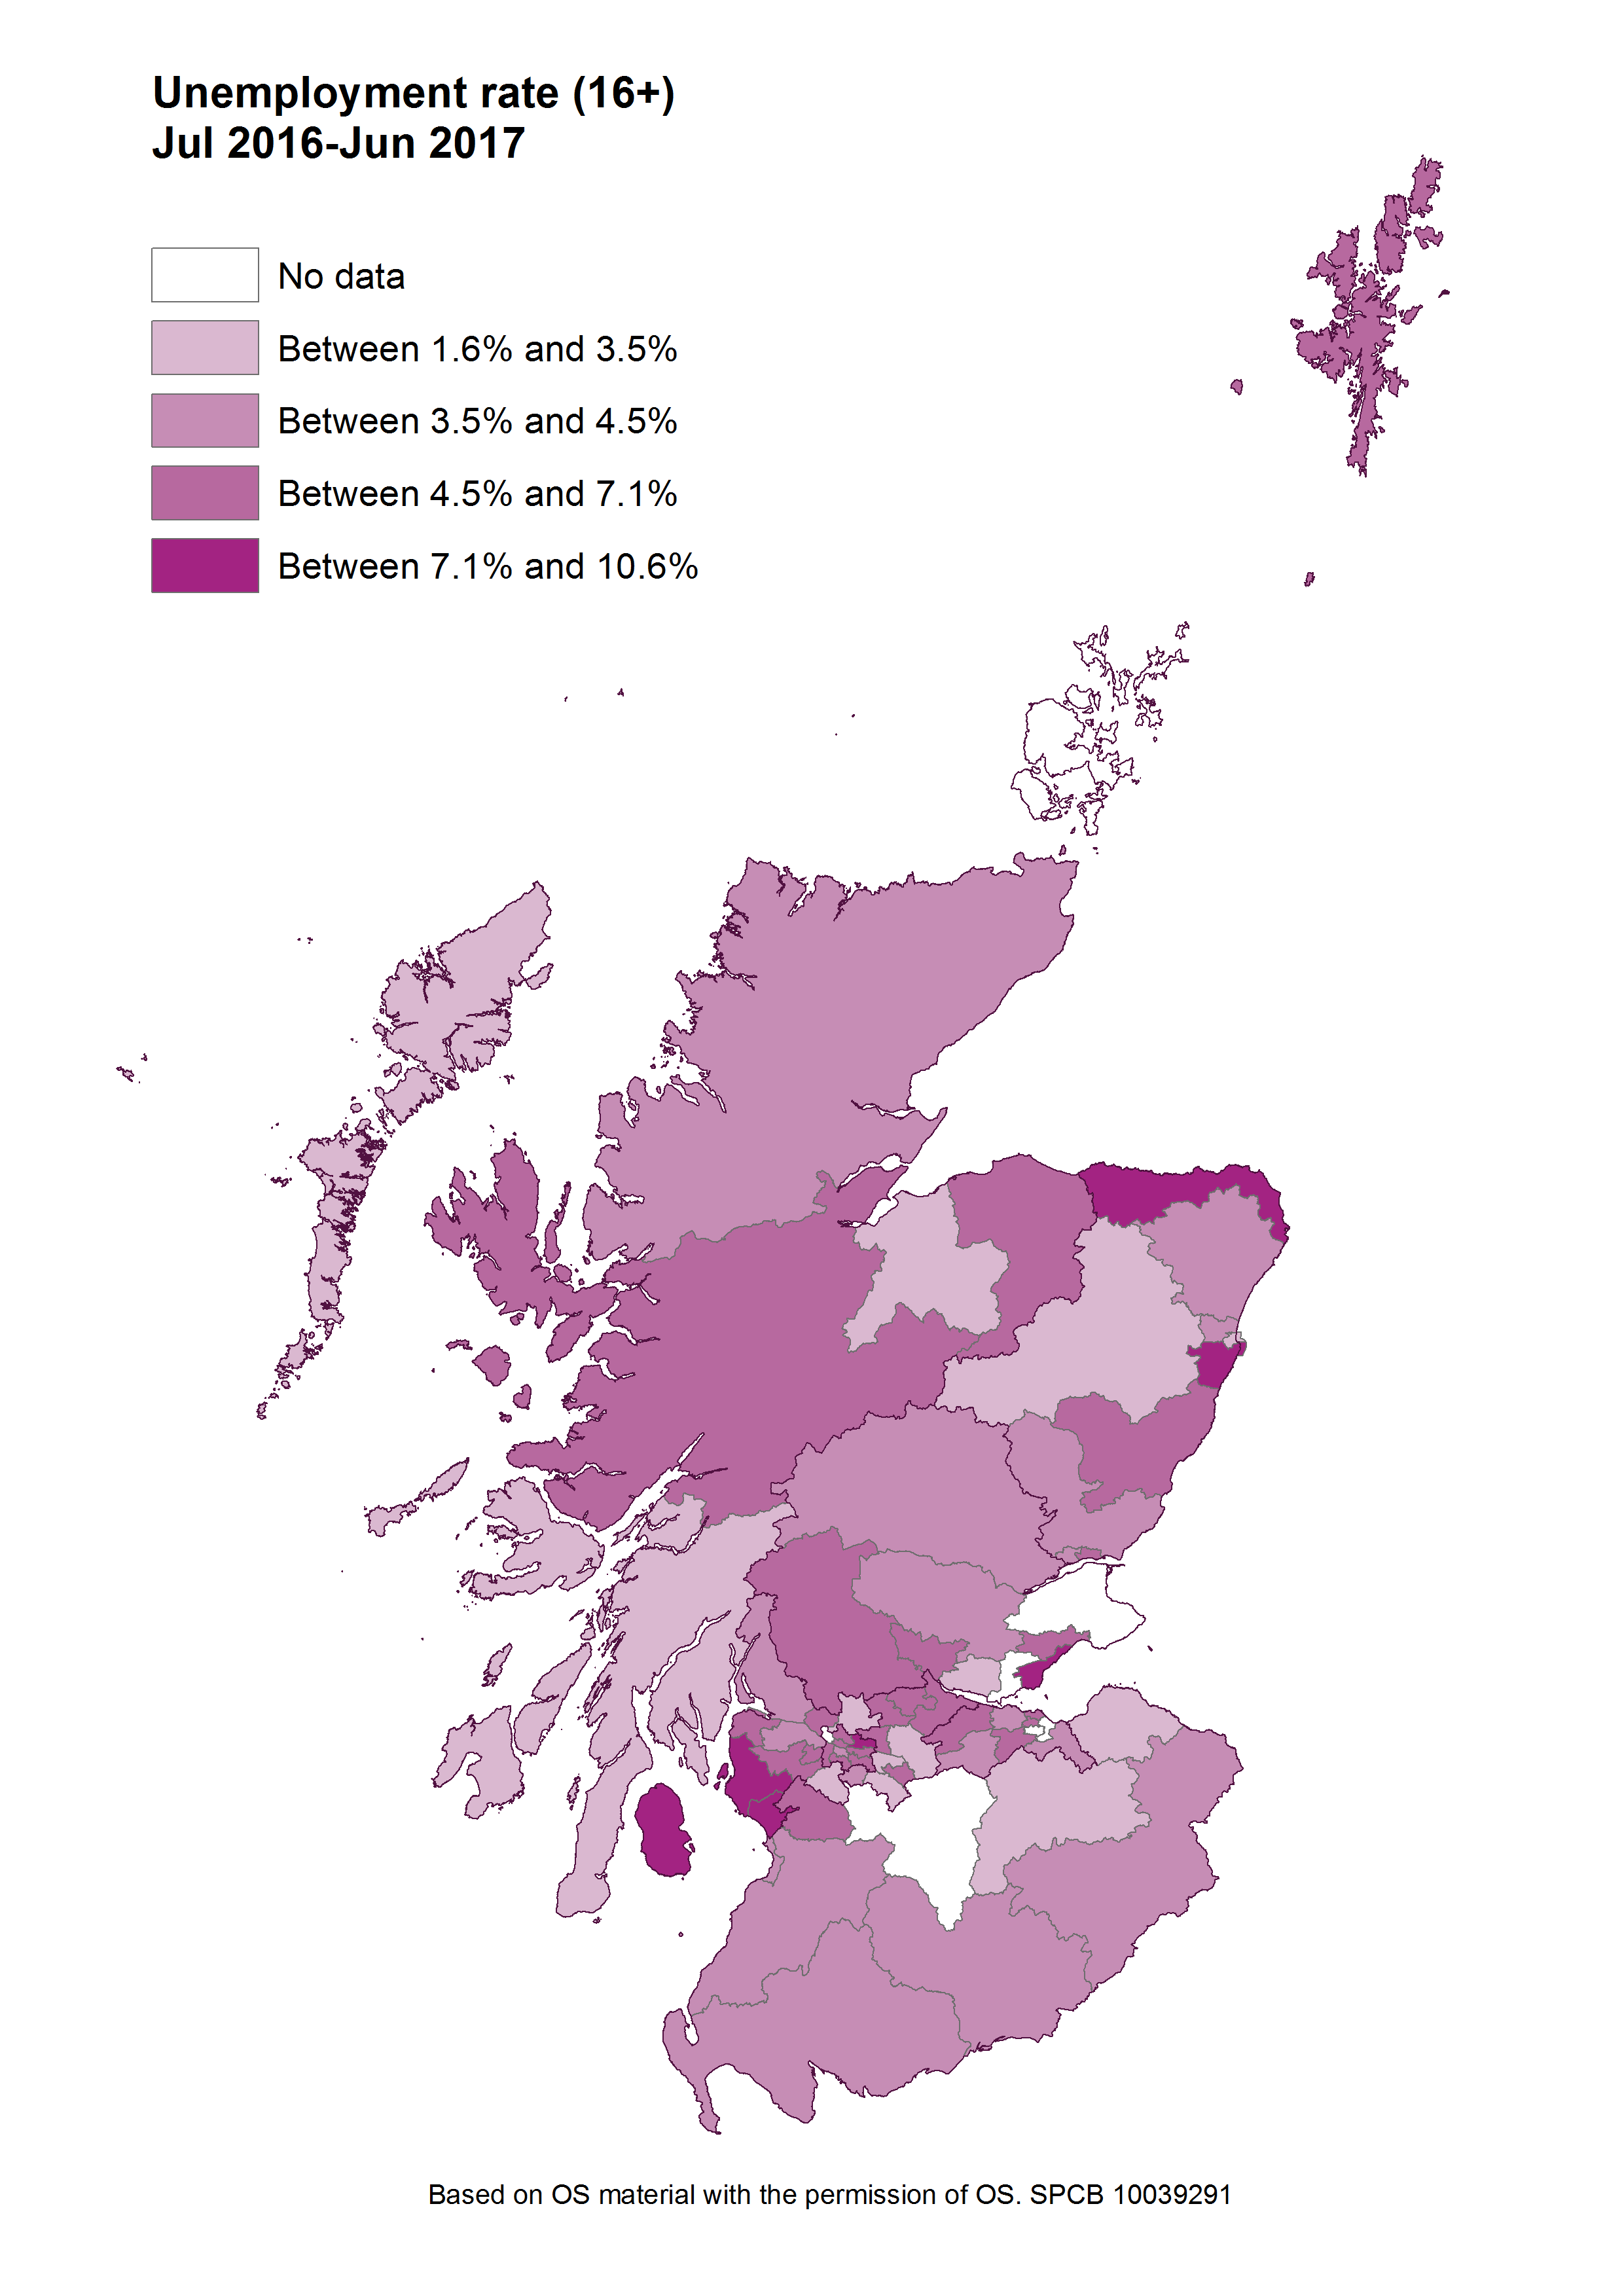
Image: Figure 4: Unemployment rate by Constituency - 2016
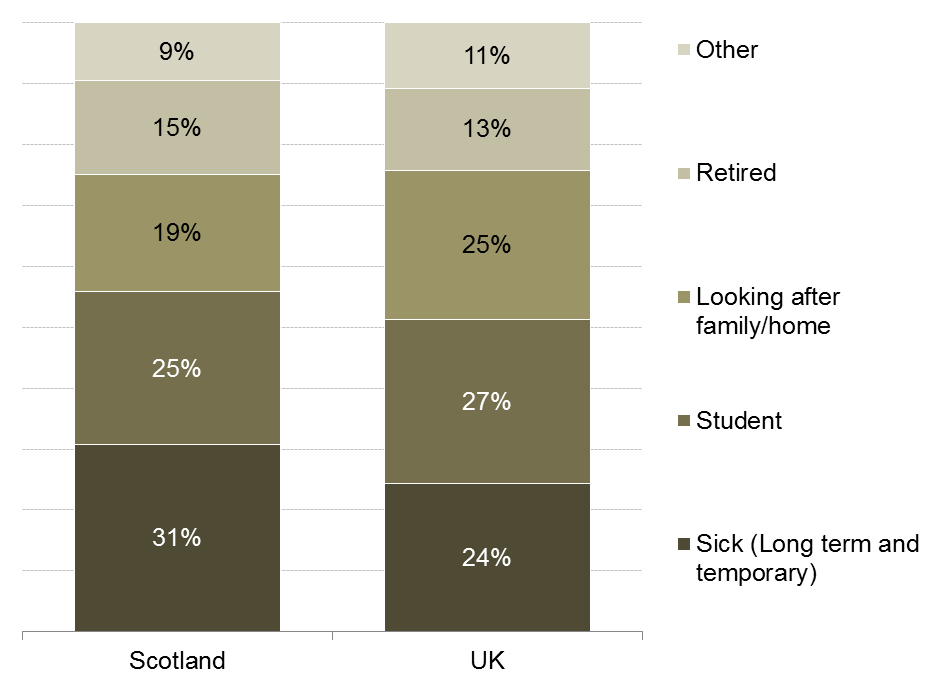
Image: Scotland has a higher proportion of people who are economically inactive due to sickness
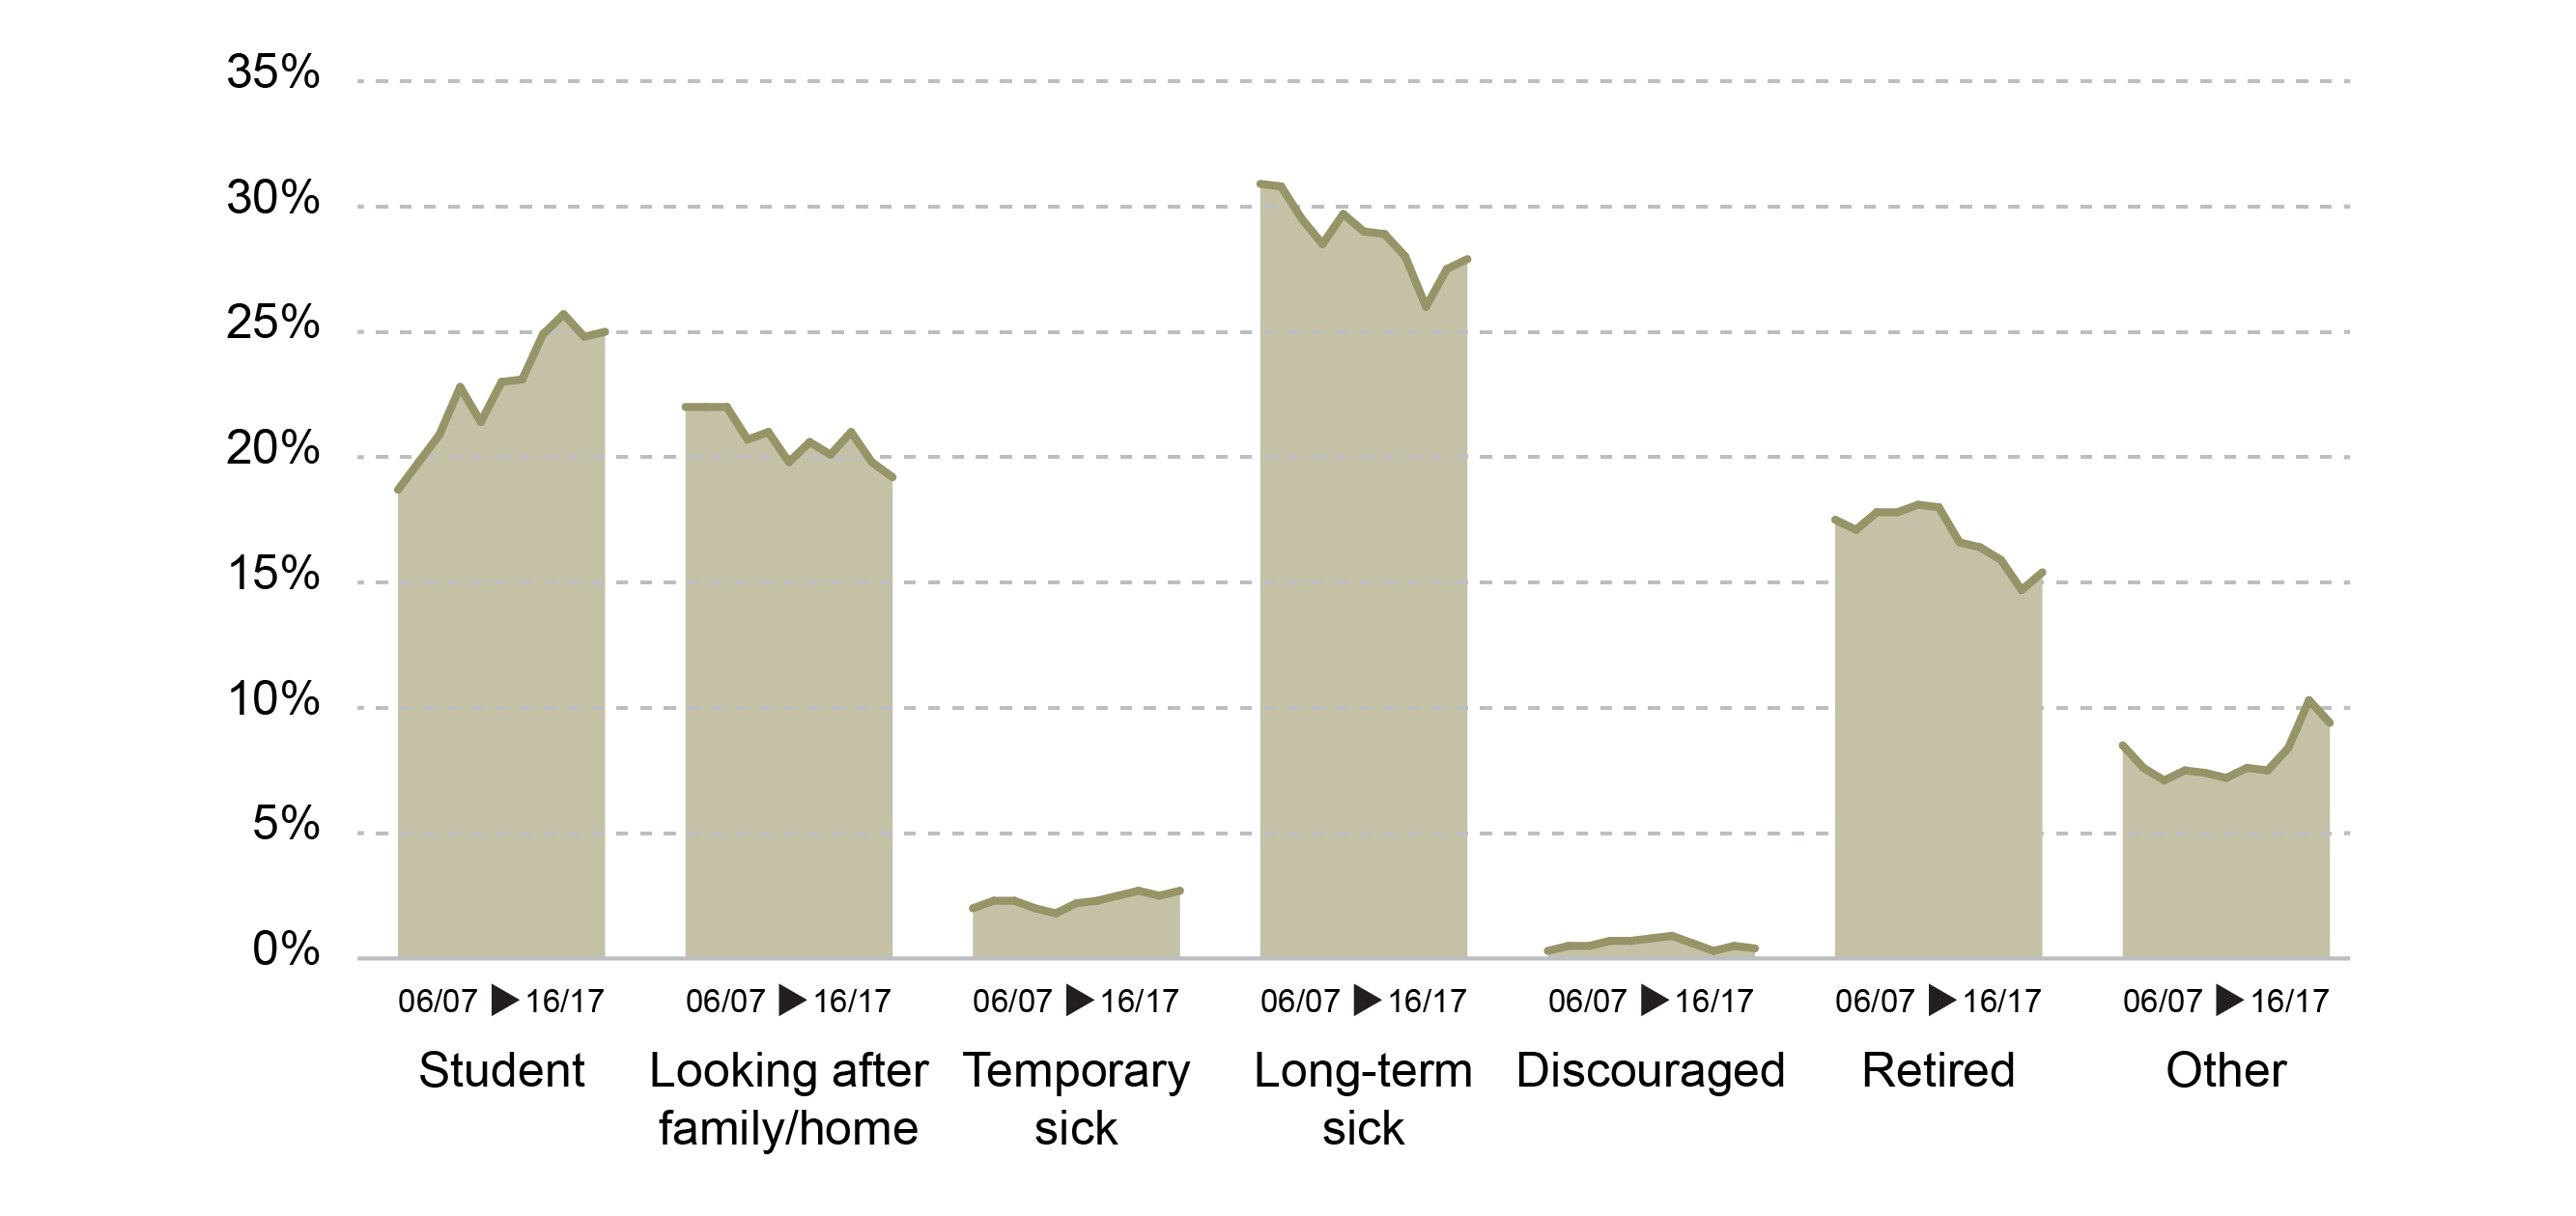
Image: Over the last 10 years the proportion of the economically inactive who are studying has increase from 19% to 25%
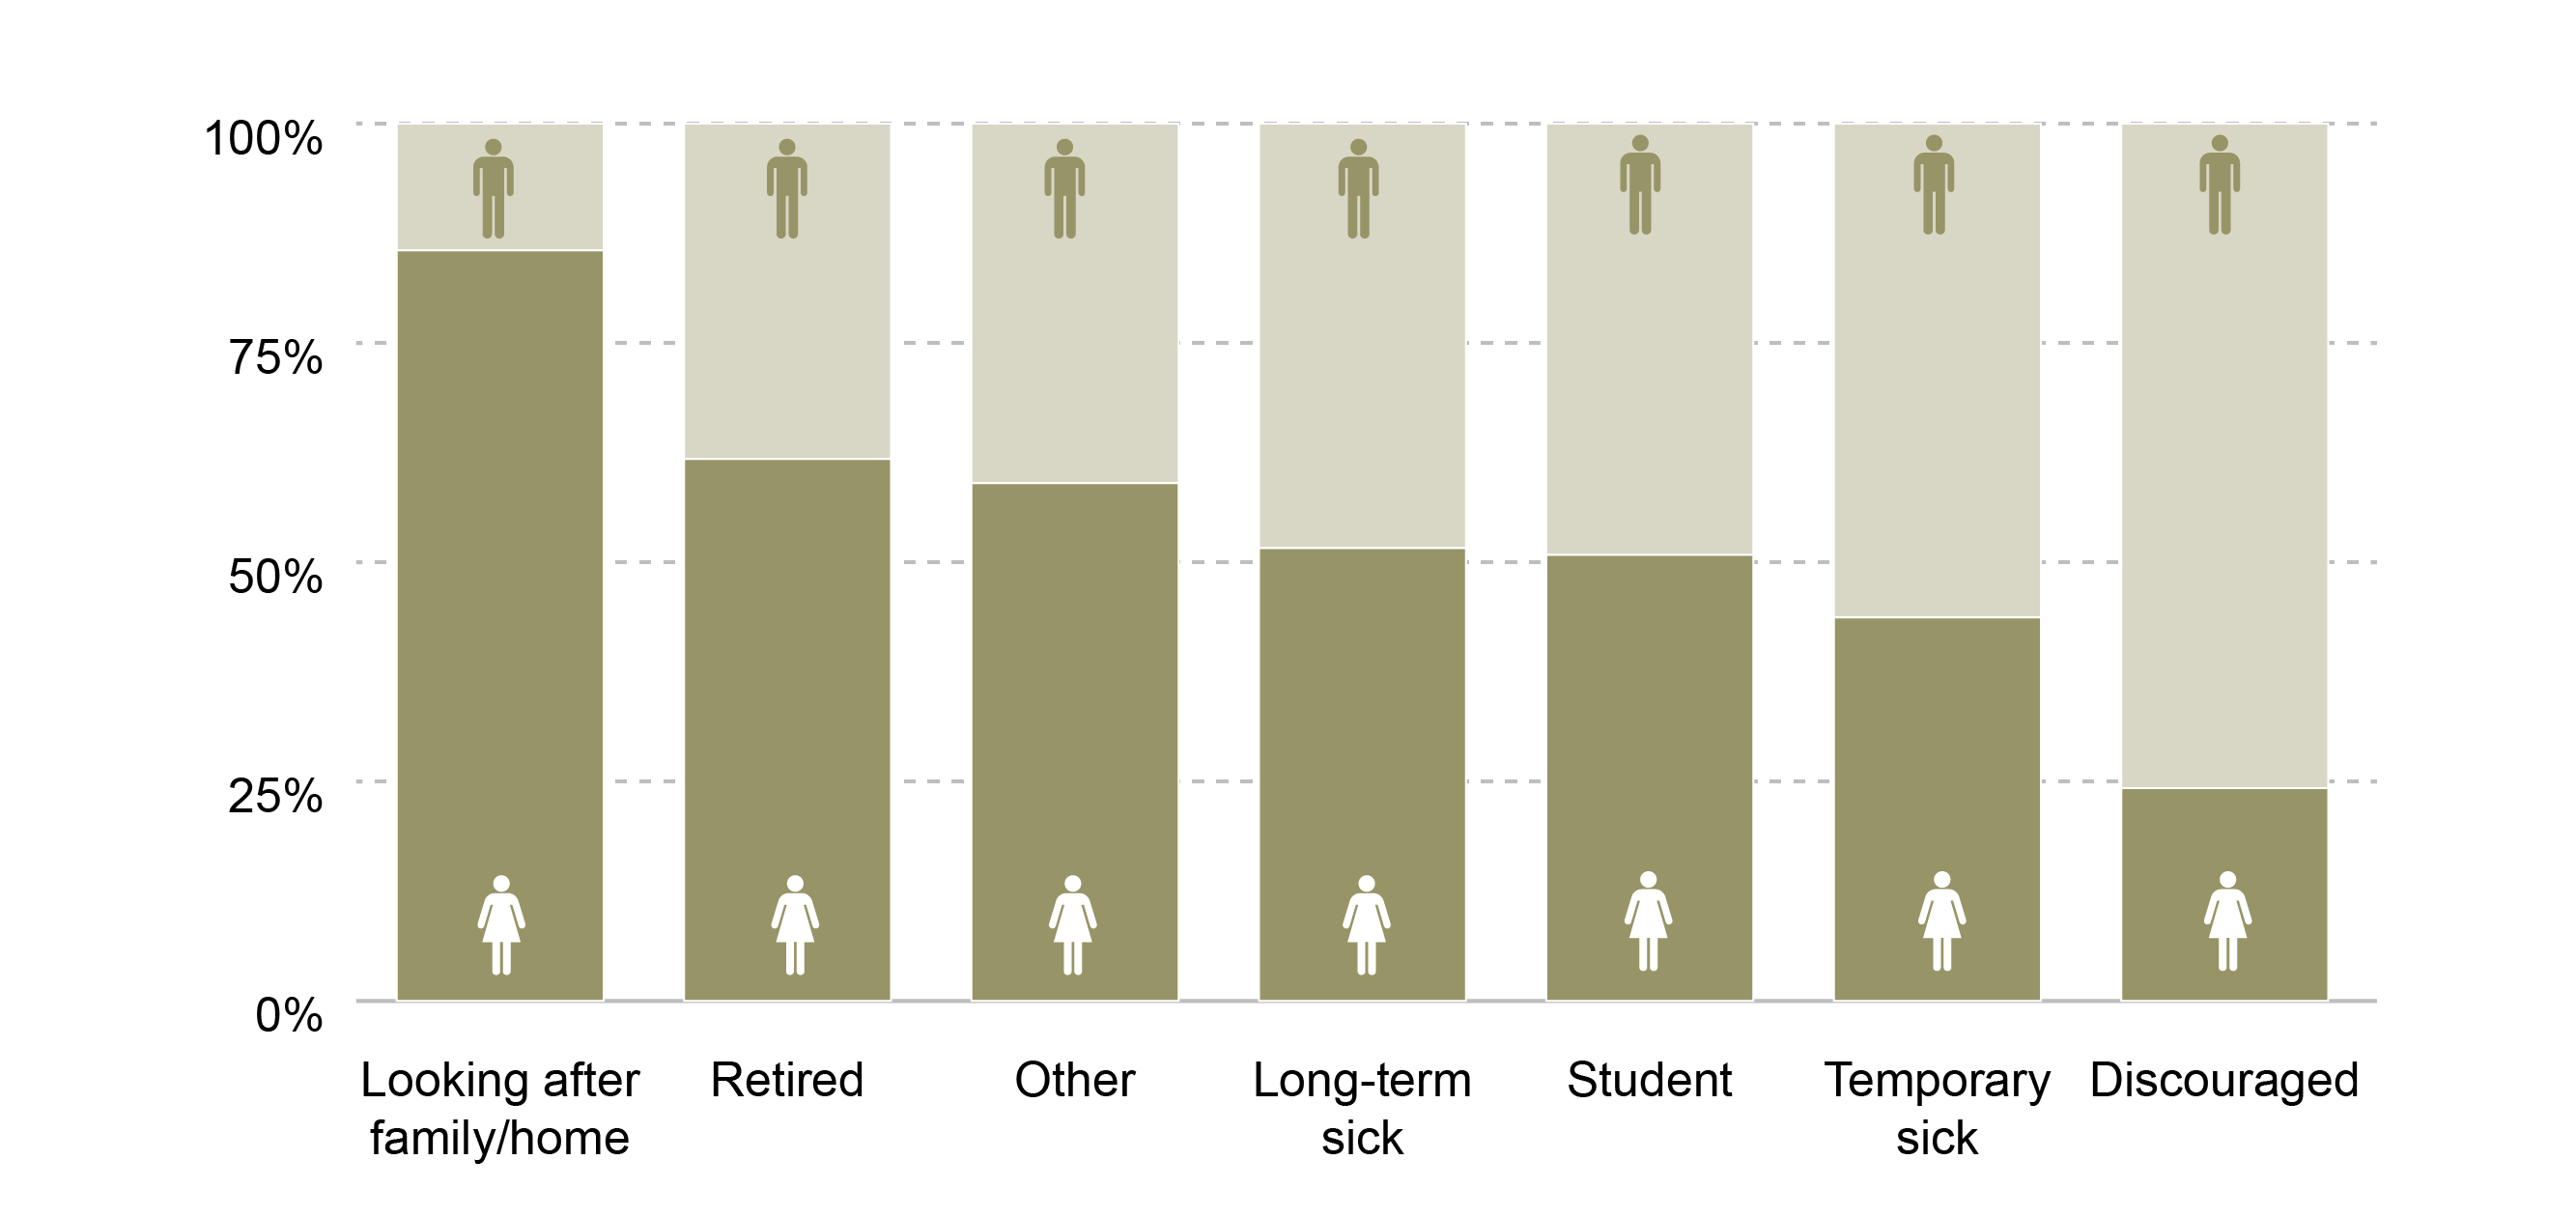
Image: Women are far more likely to look after the family/home while men are more likely to be discouraged
prev
next
Last Updated: 13/7 1:15am
An error occured while loading, please try again in a few minutes.
Refresh
BACK TO TOP